ItalyIndex EWI full analysis,charts,indicators,moving averages,SMA,DMA,EMA,ADX,MACD,RSIItaly Index EWI WideScreen charts, DMA,SMA,EMA technical analysis, forecast prediction, by indicators ADX,MACD,RSI,CCI AMEX stock exchange
Daily price and charts and targets ItalyIndex Strong Daily Stock price targets for ItalyIndex EWI are 51.2 and 51.39 | Daily Target 1 | 51.05 | | Daily Target 2 | 51.15 | | Daily Target 3 | 51.24 | | Daily Target 4 | 51.34 | | Daily Target 5 | 51.43 |
Daily price and volume Italy Index
| Date |
Closing |
Open |
Range |
Volume |
Fri 24 October 2025 |
51.25 (0.14%) |
51.18 |
51.14 - 51.33 |
0.4624 times |
Thu 23 October 2025 |
51.18 (1.01%) |
51.14 |
50.99 - 51.24 |
0.7149 times |
Wed 22 October 2025 |
50.67 (-0.84%) |
50.93 |
50.47 - 50.93 |
0.83 times |
Tue 21 October 2025 |
51.10 (-0.27%) |
51.19 |
51.10 - 51.38 |
0.6012 times |
Mon 20 October 2025 |
51.24 (0.93%) |
50.96 |
50.96 - 51.28 |
0.3121 times |
Fri 17 October 2025 |
50.77 (-0.22%) |
50.60 |
50.42 - 50.79 |
0.8161 times |
Thu 16 October 2025 |
50.88 (0.81%) |
50.76 |
50.67 - 51.18 |
0.823 times |
Wed 15 October 2025 |
50.47 (-0.63%) |
50.48 |
50.13 - 50.55 |
1.1147 times |
Tue 14 October 2025 |
50.79 (0.57%) |
50.17 |
50.05 - 50.93 |
0.8597 times |
Mon 13 October 2025 |
50.50 (0.38%) |
50.45 |
50.31 - 50.57 |
3.4661 times |
Fri 10 October 2025 |
50.31 (-1.6%) |
51.13 |
50.30 - 51.13 |
2.1592 times |
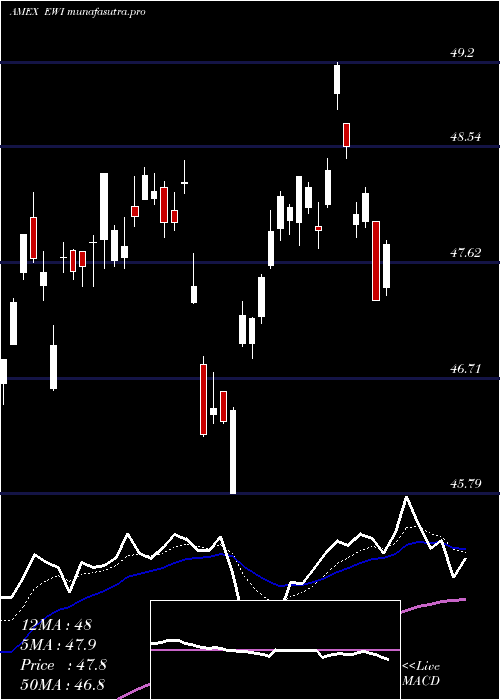
Weekly price and charts ItalyIndex Strong weekly Stock price targets for ItalyIndex EWI are 50.86 and 51.77 | Weekly Target 1 | 50.12 | | Weekly Target 2 | 50.69 | | Weekly Target 3 | 51.033333333333 | | Weekly Target 4 | 51.6 | | Weekly Target 5 | 51.94 |
Weekly price and volumes for Italy Index
| Date |
Closing |
Open |
Range |
Volume |
Fri 24 October 2025 |
51.25 (0.95%) |
50.96 |
50.47 - 51.38 |
0.5343 times |
Fri 17 October 2025 |
50.77 (0.91%) |
50.45 |
50.05 - 51.18 |
1.2952 times |
Fri 10 October 2025 |
50.31 (-4.37%) |
52.45 |
50.30 - 52.47 |
0.9812 times |
Fri 03 October 2025 |
52.61 (2.08%) |
51.59 |
51.41 - 52.68 |
1.839 times |
Fri 26 September 2025 |
51.54 (0.33%) |
51.42 |
50.71 - 51.86 |
0.6962 times |
Fri 19 September 2025 |
51.37 (-0.68%) |
52.30 |
51.08 - 52.39 |
1.2263 times |
Fri 12 September 2025 |
51.72 (2.5%) |
50.55 |
50.48 - 51.78 |
1.4433 times |
Fri 05 September 2025 |
50.46 (-1.16%) |
50.20 |
50.16 - 50.82 |
1.099 times |
Fri 29 August 2025 |
51.05 (0%) |
50.95 |
50.89 - 51.10 |
0.0802 times |
Fri 29 August 2025 |
51.05 (-2.46%) |
52.32 |
50.60 - 52.37 |
0.8052 times |
Fri 22 August 2025 |
52.34 (1.06%) |
51.48 |
51.32 - 52.56 |
1.0997 times |
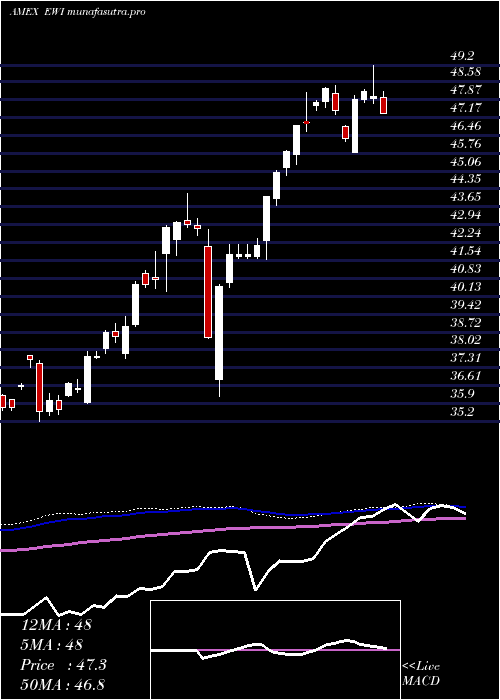
Monthly price and charts ItalyIndex Strong monthly Stock price targets for ItalyIndex EWI are 49.34 and 51.97 | Monthly Target 1 | 48.7 | | Monthly Target 2 | 49.97 | | Monthly Target 3 | 51.326666666667 | | Monthly Target 4 | 52.6 | | Monthly Target 5 | 53.96 |
Monthly price and volumes Italy Index
| Date |
Closing |
Open |
Range |
Volume |
Fri 24 October 2025 |
51.25 (-1.35%) |
52.11 |
50.05 - 52.68 |
0.8989 times |
Tue 30 September 2025 |
51.95 (1.76%) |
50.20 |
50.16 - 52.39 |
0.9451 times |
Fri 29 August 2025 |
51.05 (5.8%) |
47.86 |
47.52 - 52.56 |
0.7397 times |
Thu 31 July 2025 |
48.25 (0.23%) |
47.95 |
47.32 - 49.88 |
1.1493 times |
Mon 30 June 2025 |
48.14 (0.77%) |
47.80 |
45.79 - 48.42 |
0.6055 times |
Fri 30 May 2025 |
47.77 (8.05%) |
44.49 |
44.22 - 48.17 |
0.9919 times |
Wed 30 April 2025 |
44.21 (4.47%) |
42.51 |
36.20 - 44.68 |
1.4843 times |
Mon 31 March 2025 |
42.32 (3.73%) |
41.80 |
40.33 - 44.16 |
1.5272 times |
Fri 28 February 2025 |
40.80 (5.84%) |
37.86 |
37.68 - 41.90 |
0.9112 times |
Fri 31 January 2025 |
38.55 (7.17%) |
35.78 |
35.49 - 39.05 |
0.7469 times |
Tue 31 December 2024 |
35.97 (0.67%) |
36.57 |
35.20 - 37.80 |
0.4779 times |
DMA SMA EMA moving averages of Italy Index EWI
DMA (daily moving average) of Italy Index EWI
| DMA period | DMA value | | 5 day DMA | 51.09 | | 12 day DMA | 50.86 | | 20 day DMA | 51.38 | | 35 day DMA | 51.4 | | 50 day DMA | 51.34 | | 100 day DMA | 49.89 | | 150 day DMA | 47.88 | | 200 day DMA | 45.92 | EMA (exponential moving average) of Italy Index EWI
| EMA period | EMA current | EMA prev | EMA prev2 | | 5 day EMA | 51.08 | 50.99 | 50.89 | | 12 day EMA | 51.1 | 51.07 | 51.05 | | 20 day EMA | 51.2 | 51.19 | 51.19 | | 35 day EMA | 51.25 | 51.25 | 51.25 | | 50 day EMA | 51.29 | 51.29 | 51.29 |
SMA (simple moving average) of Italy Index EWI
| SMA period | SMA current | SMA prev | SMA prev2 | | 5 day SMA | 51.09 | 50.99 | 50.93 | | 12 day SMA | 50.86 | 50.94 | 51.01 | | 20 day SMA | 51.38 | 51.39 | 51.38 | | 35 day SMA | 51.4 | 51.38 | 51.36 | | 50 day SMA | 51.34 | 51.35 | 51.36 | | 100 day SMA | 49.89 | 49.86 | 49.83 | | 150 day SMA | 47.88 | 47.83 | 47.78 | | 200 day SMA | 45.92 | 45.85 | 45.77 |
|
|
