EatonVance EVV full analysis,charts,indicators,moving averages,SMA,DMA,EMA,ADX,MACD,RSIEaton Vance EVV WideScreen charts, DMA,SMA,EMA technical analysis, forecast prediction, by indicators ADX,MACD,RSI,CCI AMEX stock exchange
Daily price and charts and targets EatonVance Strong Daily Stock price targets for EatonVance EVV are 10.04 and 10.1 | Daily Target 1 | 10.02 | | Daily Target 2 | 10.05 | | Daily Target 3 | 10.08 | | Daily Target 4 | 10.11 | | Daily Target 5 | 10.14 |
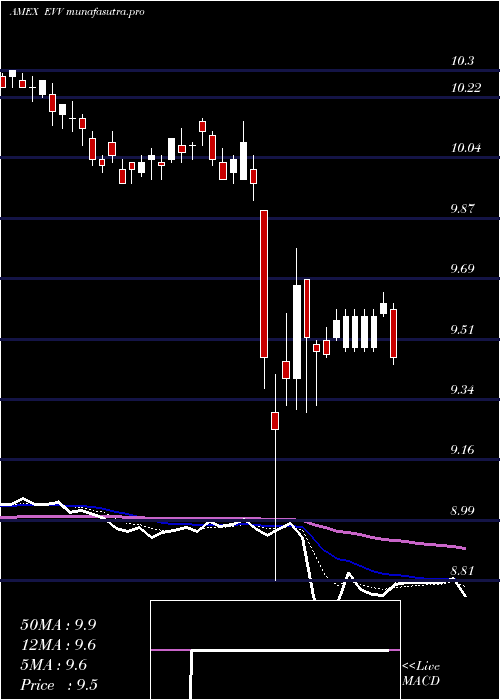
Daily price and volume Eaton Vance
| Date |
Closing |
Open |
Range |
Volume |
Fri 24 October 2025 |
10.08 (0.2%) |
10.10 |
10.05 - 10.11 |
0.8917 times |
Thu 23 October 2025 |
10.06 (0.3%) |
10.08 |
10.03 - 10.10 |
0.76 times |
Wed 22 October 2025 |
10.03 (0.91%) |
9.97 |
9.96 - 10.04 |
1.3412 times |
Tue 21 October 2025 |
9.94 (0.4%) |
9.93 |
9.90 - 9.95 |
1.11 times |
Mon 20 October 2025 |
9.90 (0.2%) |
9.92 |
9.86 - 9.94 |
0.9321 times |
Fri 17 October 2025 |
9.88 (-0.5%) |
9.96 |
9.85 - 9.96 |
1.3458 times |
Thu 16 October 2025 |
9.93 (-1%) |
10.06 |
9.91 - 10.06 |
0.9619 times |
Wed 15 October 2025 |
10.03 (0.1%) |
10.06 |
10.00 - 10.09 |
0.7825 times |
Tue 14 October 2025 |
10.02 (-1.09%) |
10.05 |
9.99 - 10.07 |
0.9674 times |
Mon 13 October 2025 |
10.13 (-0.39%) |
10.12 |
10.05 - 10.13 |
0.9074 times |
Tue 07 October 2025 |
10.17 (0.59%) |
10.12 |
10.12 - 10.20 |
1.2054 times |
Weekly price and charts EatonVance Strong weekly Stock price targets for EatonVance EVV are 9.97 and 10.22 | Weekly Target 1 | 9.77 | | Weekly Target 2 | 9.92 | | Weekly Target 3 | 10.016666666667 | | Weekly Target 4 | 10.17 | | Weekly Target 5 | 10.27 |
Weekly price and volumes for Eaton Vance
| Date |
Closing |
Open |
Range |
Volume |
Fri 24 October 2025 |
10.08 (2.02%) |
9.92 |
9.86 - 10.11 |
1.0749 times |
Fri 17 October 2025 |
9.88 (-2.85%) |
10.12 |
9.85 - 10.13 |
1.06 times |
Tue 07 October 2025 |
10.17 (0.59%) |
10.13 |
10.07 - 10.20 |
0.507 times |
Fri 03 October 2025 |
10.11 (0.1%) |
10.16 |
10.08 - 10.25 |
1.1417 times |
Fri 26 September 2025 |
10.10 (-0.39%) |
10.14 |
10.10 - 10.26 |
1.0703 times |
Fri 19 September 2025 |
10.14 (-0.78%) |
10.25 |
10.13 - 10.29 |
1.3812 times |
Fri 12 September 2025 |
10.22 (-1.35%) |
10.36 |
10.20 - 10.41 |
1.2439 times |
Fri 05 September 2025 |
10.36 (0.39%) |
10.25 |
10.21 - 10.39 |
0.777 times |
Fri 29 August 2025 |
10.32 (0%) |
10.32 |
10.27 - 10.33 |
0.1529 times |
Fri 29 August 2025 |
10.32 (1.67%) |
10.20 |
10.16 - 10.36 |
1.591 times |
Fri 22 August 2025 |
10.15 (0.2%) |
10.15 |
10.06 - 10.17 |
1.0464 times |

Monthly price and charts EatonVance Strong monthly Stock price targets for EatonVance EVV are 9.77 and 10.17 | Monthly Target 1 | 9.66 | | Monthly Target 2 | 9.87 | | Monthly Target 3 | 10.06 | | Monthly Target 4 | 10.27 | | Monthly Target 5 | 10.46 |
Monthly price and volumes Eaton Vance
| Date |
Closing |
Open |
Range |
Volume |
Fri 24 October 2025 |
10.08 (-0.69%) |
10.16 |
9.85 - 10.25 |
0.8082 times |
Tue 30 September 2025 |
10.15 (-1.65%) |
10.25 |
10.08 - 10.41 |
1.1719 times |
Fri 29 August 2025 |
10.32 (2.18%) |
10.08 |
10.03 - 10.36 |
1.1483 times |
Thu 31 July 2025 |
10.10 (-1.56%) |
10.22 |
10.03 - 10.39 |
1.0848 times |
Mon 30 June 2025 |
10.26 (2.7%) |
9.99 |
9.98 - 10.27 |
0.65 times |
Fri 30 May 2025 |
9.99 (1.01%) |
9.79 |
9.79 - 10.00 |
0.854 times |
Wed 30 April 2025 |
9.89 (-0.9%) |
10.00 |
8.81 - 10.15 |
1.156 times |
Mon 31 March 2025 |
9.98 (-2.63%) |
10.23 |
9.97 - 10.27 |
1.008 times |
Fri 28 February 2025 |
10.25 (0.39%) |
10.05 |
9.91 - 10.38 |
0.9469 times |
Fri 31 January 2025 |
10.21 (4.5%) |
9.82 |
9.76 - 10.23 |
1.1718 times |
Tue 31 December 2024 |
9.77 (-3.46%) |
10.29 |
9.74 - 10.39 |
1.0942 times |

DMA SMA EMA moving averages of Eaton Vance EVV
DMA (daily moving average) of Eaton Vance EVV
| DMA period | DMA value | | 5 day DMA | 10 | | 12 day DMA | 10.02 | | 20 day DMA | 10.08 | | 35 day DMA | 10.16 | | 50 day DMA | 10.17 | | 100 day DMA | 10.15 | | 150 day DMA | 10.04 | | 200 day DMA | 10.06 | EMA (exponential moving average) of Eaton Vance EVV
| EMA period | EMA current | EMA prev | EMA prev2 | | 5 day EMA | 10.03 | 10.01 | 9.98 | | 12 day EMA | 10.04 | 10.03 | 10.02 | | 20 day EMA | 10.08 | 10.08 | 10.08 | | 35 day EMA | 10.11 | 10.11 | 10.11 | | 50 day EMA | 10.16 | 10.16 | 10.16 |
SMA (simple moving average) of Eaton Vance EVV
| SMA period | SMA current | SMA prev | SMA prev2 | | 5 day SMA | 10 | 9.96 | 9.94 | | 12 day SMA | 10.02 | 10.03 | 10.03 | | 20 day SMA | 10.08 | 10.08 | 10.09 | | 35 day SMA | 10.16 | 10.16 | 10.17 | | 50 day SMA | 10.17 | 10.18 | 10.18 | | 100 day SMA | 10.15 | 10.15 | 10.15 | | 150 day SMA | 10.04 | 10.04 | 10.04 | | 200 day SMA | 10.06 | 10.06 | 10.06 |
|
|
