FlexsharesGlobal ESGG full analysis,charts,indicators,moving averages,SMA,DMA,EMA,ADX,MACD,RSIFlexshares Global ESGG WideScreen charts, DMA,SMA,EMA technical analysis, forecast prediction, by indicators ADX,MACD,RSI,CCI AMEX stock exchange
Daily price and charts and targets FlexsharesGlobal Strong Daily Stock price targets for FlexsharesGlobal ESGG are 200.49 and 201.03 | Daily Target 1 | 200.4 | | Daily Target 2 | 200.58 | | Daily Target 3 | 200.94 | | Daily Target 4 | 201.12 | | Daily Target 5 | 201.48 |
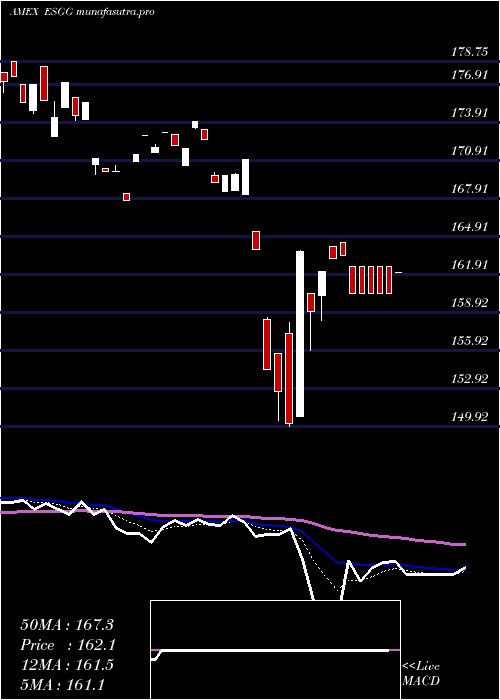
Daily price and volume Flexshares Global
| Date |
Closing |
Open |
Range |
Volume |
Fri 24 October 2025 |
200.76 (0.34%) |
201.24 |
200.76 - 201.30 |
1.5138 times |
Thu 23 October 2025 |
200.07 (0.21%) |
199.90 |
199.90 - 200.07 |
0.3641 times |
Wed 22 October 2025 |
199.66 (0%) |
199.10 |
199.10 - 199.10 |
0 times |
Tue 21 October 2025 |
199.66 (0.26%) |
199.66 |
199.66 - 199.66 |
0.5601 times |
Mon 20 October 2025 |
199.14 (0.61%) |
199.14 |
199.14 - 199.14 |
0.14 times |
Fri 17 October 2025 |
197.93 (0.59%) |
197.93 |
197.93 - 197.93 |
0.4201 times |
Thu 16 October 2025 |
196.76 (-0.55%) |
198.36 |
196.76 - 198.36 |
2.1005 times |
Wed 15 October 2025 |
197.84 (0.38%) |
197.90 |
197.84 - 198.85 |
1.4004 times |
Tue 14 October 2025 |
197.09 (0.06%) |
195.88 |
194.81 - 197.09 |
1.4004 times |
Mon 13 October 2025 |
196.97 (-1.04%) |
195.85 |
195.85 - 196.97 |
2.1005 times |
Tue 07 October 2025 |
199.04 (-0.36%) |
199.04 |
199.04 - 199.04 |
0.4201 times |
Weekly price and charts FlexsharesGlobal Strong weekly Stock price targets for FlexsharesGlobal ESGG are 199.93 and 202.13 | Weekly Target 1 | 198.19 | | Weekly Target 2 | 199.47 | | Weekly Target 3 | 200.38666666667 | | Weekly Target 4 | 201.67 | | Weekly Target 5 | 202.59 |
Weekly price and volumes for Flexshares Global
| Date |
Closing |
Open |
Range |
Volume |
Fri 24 October 2025 |
200.76 (1.43%) |
199.14 |
199.10 - 201.30 |
0.9663 times |
Fri 17 October 2025 |
197.93 (-0.56%) |
195.85 |
194.81 - 198.85 |
2.7819 times |
Tue 07 October 2025 |
199.04 (-0.02%) |
200.06 |
199.04 - 200.06 |
0.21 times |
Fri 03 October 2025 |
199.07 (1.51%) |
196.19 |
196.19 - 199.07 |
1.4229 times |
Fri 26 September 2025 |
196.11 (-0.1%) |
197.33 |
194.61 - 197.48 |
1.3647 times |
Fri 19 September 2025 |
196.30 (0.58%) |
195.52 |
195.52 - 196.92 |
0.8923 times |
Fri 12 September 2025 |
195.17 (1.37%) |
192.80 |
192.80 - 195.38 |
0.5774 times |
Fri 05 September 2025 |
192.54 (-0.16%) |
190.46 |
190.38 - 193.16 |
1.3122 times |
Fri 29 August 2025 |
192.84 (0%) |
192.84 |
192.84 - 192.84 |
0.105 times |
Fri 29 August 2025 |
192.84 (-0.77%) |
192.92 |
192.84 - 193.89 |
0.3674 times |
Fri 22 August 2025 |
194.34 (0.34%) |
192.84 |
191.57 - 194.47 |
6.1411 times |

Monthly price and charts FlexsharesGlobal Strong monthly Stock price targets for FlexsharesGlobal ESGG are 197.79 and 204.28 | Monthly Target 1 | 192.47 | | Monthly Target 2 | 196.61 | | Monthly Target 3 | 198.95666666667 | | Monthly Target 4 | 203.1 | | Monthly Target 5 | 205.45 |
Monthly price and volumes Flexshares Global
| Date |
Closing |
Open |
Range |
Volume |
Fri 24 October 2025 |
200.76 (1.7%) |
198.18 |
194.81 - 201.30 |
0.3124 times |
Tue 30 September 2025 |
197.41 (2.37%) |
190.46 |
190.38 - 197.48 |
0.3282 times |
Fri 29 August 2025 |
192.84 (2.16%) |
186.33 |
186.33 - 194.47 |
0.6353 times |
Thu 31 July 2025 |
188.77 (0.6%) |
187.43 |
187.04 - 191.61 |
1.1336 times |
Mon 30 June 2025 |
187.64 (4.27%) |
179.11 |
177.75 - 187.64 |
0.3192 times |
Fri 30 May 2025 |
179.96 (5.7%) |
171.25 |
170.97 - 180.36 |
0.4022 times |
Wed 30 April 2025 |
170.25 (0.28%) |
168.55 |
149.92 - 171.03 |
2.562 times |
Mon 31 March 2025 |
169.77 (-4.06%) |
178.33 |
167.81 - 178.33 |
0.9875 times |
Fri 28 February 2025 |
176.95 (0.48%) |
173.35 |
173.35 - 180.65 |
1.3553 times |
Fri 31 January 2025 |
176.11 (4.8%) |
168.55 |
166.80 - 177.02 |
1.9642 times |
Tue 31 December 2024 |
168.04 (-2.39%) |
174.44 |
167.45 - 176.21 |
7.8623 times |

DMA SMA EMA moving averages of Flexshares Global ESGG
DMA (daily moving average) of Flexshares Global ESGG
| DMA period | DMA value | | 5 day DMA | 199.86 | | 12 day DMA | 198.72 | | 20 day DMA | 198.05 | | 35 day DMA | 196.71 | | 50 day DMA | 195.62 | | 100 day DMA | 191.08 | | 150 day DMA | 183.8 | | 200 day DMA | 181.48 | EMA (exponential moving average) of Flexshares Global ESGG
| EMA period | EMA current | EMA prev | EMA prev2 | | 5 day EMA | 199.81 | 199.34 | 198.98 | | 12 day EMA | 198.91 | 198.57 | 198.3 | | 20 day EMA | 198.16 | 197.89 | 197.66 | | 35 day EMA | 196.86 | 196.63 | 196.43 | | 50 day EMA | 195.63 | 195.42 | 195.23 |
SMA (simple moving average) of Flexshares Global ESGG
| SMA period | SMA current | SMA prev | SMA prev2 | | 5 day SMA | 199.86 | 199.29 | 198.63 | | 12 day SMA | 198.72 | 198.58 | 198.44 | | 20 day SMA | 198.05 | 197.83 | 197.68 | | 35 day SMA | 196.71 | 196.44 | 196.23 | | 50 day SMA | 195.62 | 195.46 | 195.26 | | 100 day SMA | 191.08 | 190.86 | 190.66 | | 150 day SMA | 183.8 | 183.61 | 183.43 | | 200 day SMA | 181.48 | 181.32 | 181.17 |
|
|
