EmpireState ESBA full analysis,charts,indicators,moving averages,SMA,DMA,EMA,ADX,MACD,RSIEmpire State ESBA WideScreen charts, DMA,SMA,EMA technical analysis, forecast prediction, by indicators ADX,MACD,RSI,CCI AMEX stock exchange
Daily price and charts and targets EmpireState Strong Daily Stock price targets for EmpireState ESBA are 7.59 and 7.92 | Daily Target 1 | 7.35 | | Daily Target 2 | 7.5 | | Daily Target 3 | 7.6833333333333 | | Daily Target 4 | 7.83 | | Daily Target 5 | 8.01 |
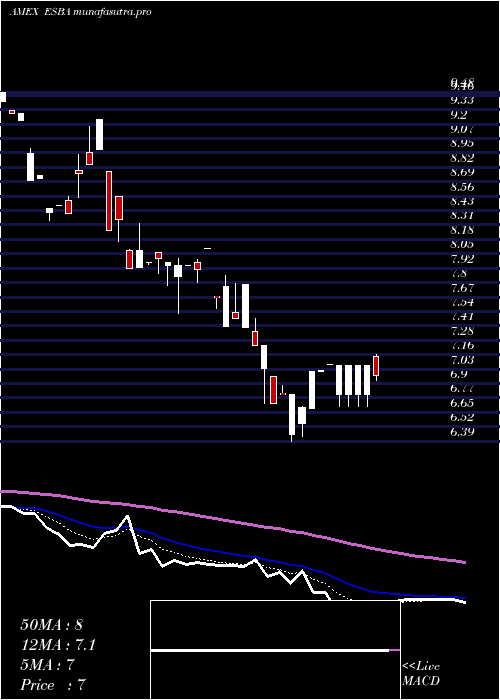
Daily price and volume Empire State
| Date |
Closing |
Open |
Range |
Volume |
Thu 23 October 2025 |
7.64 (1.19%) |
7.60 |
7.54 - 7.87 |
0.6905 times |
Wed 22 October 2025 |
7.55 (0.53%) |
7.60 |
7.55 - 7.65 |
0.8793 times |
Tue 21 October 2025 |
7.51 (8.68%) |
7.15 |
7.13 - 7.51 |
2.4038 times |
Mon 20 October 2025 |
6.91 (-1.85%) |
7.05 |
6.91 - 7.27 |
0.454 times |
Fri 17 October 2025 |
7.04 (-0.28%) |
7.04 |
7.04 - 7.04 |
0.0273 times |
Thu 16 October 2025 |
7.06 (-2.35%) |
7.11 |
7.06 - 7.11 |
0.0546 times |
Wed 15 October 2025 |
7.23 (1.69%) |
6.81 |
6.81 - 7.25 |
1.4204 times |
Tue 14 October 2025 |
7.11 (0.99%) |
7.03 |
6.99 - 7.27 |
1.2019 times |
Mon 13 October 2025 |
7.04 (0.28%) |
7.00 |
7.00 - 7.04 |
1.1746 times |
Fri 10 October 2025 |
7.02 (-1.96%) |
7.11 |
6.96 - 7.21 |
1.6936 times |
Thu 09 October 2025 |
7.16 (-3.76%) |
7.25 |
7.16 - 7.25 |
0.2185 times |
Weekly price and charts EmpireState Strong weekly Stock price targets for EmpireState ESBA are 7.28 and 8.24 | Weekly Target 1 | 6.51 | | Weekly Target 2 | 7.08 | | Weekly Target 3 | 7.4733333333333 | | Weekly Target 4 | 8.04 | | Weekly Target 5 | 8.43 |
Weekly price and volumes for Empire State
| Date |
Closing |
Open |
Range |
Volume |
Thu 23 October 2025 |
7.64 (8.52%) |
7.05 |
6.91 - 7.87 |
0.8031 times |
Fri 17 October 2025 |
7.04 (0.28%) |
7.00 |
6.81 - 7.27 |
0.7035 times |
Fri 10 October 2025 |
7.02 (-6.02%) |
7.55 |
6.96 - 7.72 |
1.5951 times |
Thu 02 October 2025 |
7.47 (0%) |
8.03 |
7.24 - 8.30 |
1.3145 times |
Thu 25 September 2025 |
7.47 (1.77%) |
7.24 |
7.12 - 7.80 |
1.7985 times |
Fri 19 September 2025 |
7.34 (-3.67%) |
7.54 |
7.25 - 7.92 |
0.3171 times |
Fri 12 September 2025 |
7.62 (-2.43%) |
7.48 |
7.40 - 7.90 |
0.8819 times |
Fri 05 September 2025 |
7.81 (5.54%) |
7.50 |
7.25 - 8.00 |
0.7184 times |
Fri 29 August 2025 |
7.40 (0%) |
7.40 |
7.40 - 7.40 |
0.0099 times |
Fri 29 August 2025 |
7.40 (-0.27%) |
7.35 |
7.21 - 7.50 |
1.8579 times |
Fri 22 August 2025 |
7.42 (2.06%) |
7.22 |
6.86 - 7.87 |
2.9826 times |

Monthly price and charts EmpireState Strong monthly Stock price targets for EmpireState ESBA are 7.23 and 8.29 | Monthly Target 1 | 6.38 | | Monthly Target 2 | 7.01 | | Monthly Target 3 | 7.44 | | Monthly Target 4 | 8.07 | | Monthly Target 5 | 8.5 |
Monthly price and volumes Empire State
| Date |
Closing |
Open |
Range |
Volume |
Thu 23 October 2025 |
7.64 (2.69%) |
7.24 |
6.81 - 7.87 |
0.6522 times |
Tue 30 September 2025 |
7.44 (0.54%) |
7.50 |
7.12 - 8.30 |
0.7707 times |
Fri 29 August 2025 |
7.40 (3.35%) |
7.15 |
6.84 - 7.87 |
1.2198 times |
Thu 31 July 2025 |
7.16 (-9.02%) |
7.60 |
7.08 - 8.30 |
0.6726 times |
Mon 30 June 2025 |
7.87 (5.64%) |
7.14 |
7.14 - 8.75 |
0.9025 times |
Fri 30 May 2025 |
7.45 (5.23%) |
6.94 |
6.66 - 7.94 |
1.1946 times |
Wed 30 April 2025 |
7.08 (-8.76%) |
7.53 |
6.39 - 7.79 |
1.0364 times |
Mon 31 March 2025 |
7.76 (-16.02%) |
8.78 |
7.41 - 8.78 |
1.4376 times |
Fri 28 February 2025 |
9.24 (0.11%) |
9.06 |
8.35 - 9.53 |
1.2492 times |
Fri 31 January 2025 |
9.23 (-9.33%) |
10.44 |
8.81 - 10.85 |
0.8644 times |
Tue 31 December 2024 |
10.18 (-6%) |
10.75 |
9.60 - 11.28 |
2.3433 times |

DMA SMA EMA moving averages of Empire State ESBA
DMA (daily moving average) of Empire State ESBA
| DMA period | DMA value | | 5 day DMA | 7.33 | | 12 day DMA | 7.23 | | 20 day DMA | 7.33 | | 35 day DMA | 7.4 | | 50 day DMA | 7.37 | | 100 day DMA | 7.56 | | 150 day DMA | 7.54 | | 200 day DMA | 8.13 | EMA (exponential moving average) of Empire State ESBA
| EMA period | EMA current | EMA prev | EMA prev2 | | 5 day EMA | 7.43 | 7.32 | 7.2 | | 12 day EMA | 7.32 | 7.26 | 7.21 | | 20 day EMA | 7.33 | 7.3 | 7.27 | | 35 day EMA | 7.33 | 7.31 | 7.3 | | 50 day EMA | 7.36 | 7.35 | 7.34 |
SMA (simple moving average) of Empire State ESBA
| SMA period | SMA current | SMA prev | SMA prev2 | | 5 day SMA | 7.33 | 7.21 | 7.15 | | 12 day SMA | 7.23 | 7.22 | 7.23 | | 20 day SMA | 7.33 | 7.31 | 7.29 | | 35 day SMA | 7.4 | 7.39 | 7.39 | | 50 day SMA | 7.37 | 7.36 | 7.36 | | 100 day SMA | 7.56 | 7.56 | 7.56 | | 150 day SMA | 7.54 | 7.54 | 7.55 | | 200 day SMA | 8.13 | 8.14 | 8.16 |
|
|
