EnergyBull ERX full analysis,charts,indicators,moving averages,SMA,DMA,EMA,ADX,MACD,RSIEnergy Bull ERX WideScreen charts, DMA,SMA,EMA technical analysis, forecast prediction, by indicators ADX,MACD,RSI,CCI AMEX stock exchange
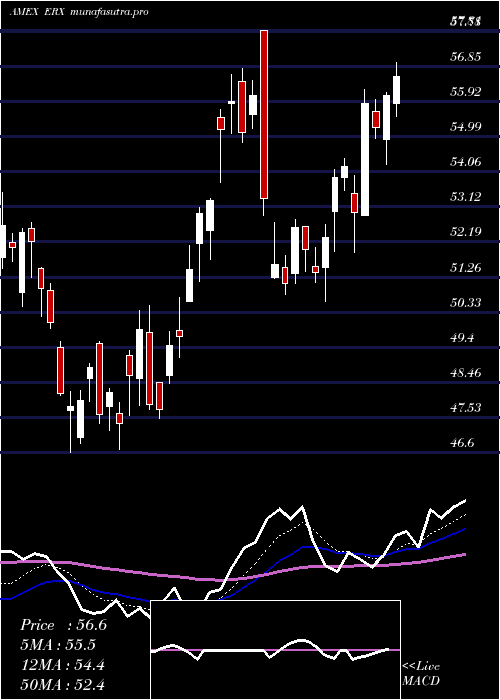
Daily price and charts and targets EnergyBull Strong Daily Stock price targets for EnergyBull ERX are 53.17 and 55.56 | Daily Target 1 | 52.76 | | Daily Target 2 | 53.58 | | Daily Target 3 | 55.15 | | Daily Target 4 | 55.97 | | Daily Target 5 | 57.54 |
Daily price and volume Energy Bull
| Date |
Closing |
Open |
Range |
Volume |
Fri 24 October 2025 |
54.40 (-2.09%) |
55.27 |
54.33 - 56.72 |
0.6429 times |
Thu 23 October 2025 |
55.56 (2.62%) |
54.99 |
54.93 - 56.31 |
1.5085 times |
Wed 22 October 2025 |
54.14 (2.64%) |
53.20 |
52.61 - 54.57 |
1.8111 times |
Tue 21 October 2025 |
52.75 (-0.51%) |
53.32 |
52.27 - 53.56 |
1.4494 times |
Mon 20 October 2025 |
53.02 (2.08%) |
51.73 |
51.73 - 53.25 |
0.5959 times |
Fri 17 October 2025 |
51.94 (1.45%) |
50.90 |
50.25 - 52.69 |
0.6109 times |
Thu 16 October 2025 |
51.20 (-2.4%) |
52.64 |
50.50 - 52.85 |
0.7935 times |
Wed 15 October 2025 |
52.46 (0.04%) |
53.12 |
51.66 - 53.70 |
0.7551 times |
Tue 14 October 2025 |
52.44 (-0.23%) |
51.17 |
50.91 - 53.05 |
0.934 times |
Mon 13 October 2025 |
52.56 (2.72%) |
52.00 |
51.58 - 52.61 |
0.8986 times |
Fri 10 October 2025 |
51.17 (-5.68%) |
53.56 |
51.10 - 53.99 |
1.3971 times |
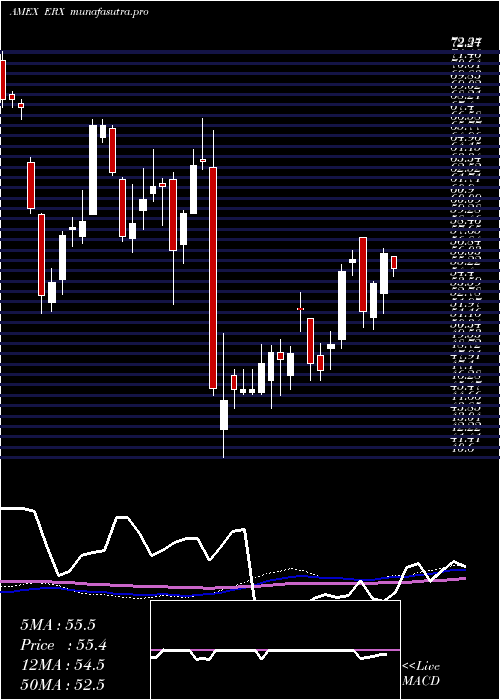
Weekly price and charts EnergyBull Strong weekly Stock price targets for EnergyBull ERX are 53.07 and 58.06 | Weekly Target 1 | 49.29 | | Weekly Target 2 | 51.85 | | Weekly Target 3 | 54.283333333333 | | Weekly Target 4 | 56.84 | | Weekly Target 5 | 59.27 |
Weekly price and volumes for Energy Bull
| Date |
Closing |
Open |
Range |
Volume |
Fri 24 October 2025 |
54.40 (4.74%) |
51.73 |
51.73 - 56.72 |
1.1415 times |
Fri 17 October 2025 |
51.94 (1.5%) |
52.00 |
50.25 - 53.70 |
0.7585 times |
Fri 10 October 2025 |
51.17 (-8.3%) |
56.50 |
51.10 - 57.04 |
0.9927 times |
Fri 03 October 2025 |
55.80 (-6.7%) |
59.11 |
55.10 - 59.11 |
1.5047 times |
Fri 26 September 2025 |
59.81 (8.9%) |
54.45 |
54.09 - 60.96 |
1.2083 times |
Fri 19 September 2025 |
54.92 (-0.24%) |
55.33 |
54.52 - 57.58 |
0.9028 times |
Fri 12 September 2025 |
55.05 (2.67%) |
53.98 |
52.47 - 56.73 |
1.1953 times |
Fri 05 September 2025 |
53.62 (-6.68%) |
57.16 |
53.10 - 57.88 |
0.978 times |
Fri 29 August 2025 |
57.46 (0%) |
56.94 |
56.85 - 57.81 |
0.2483 times |
Fri 29 August 2025 |
57.46 (4.89%) |
54.63 |
53.86 - 57.81 |
1.0701 times |
Fri 22 August 2025 |
54.78 (5.94%) |
51.20 |
50.50 - 55.04 |
1.032 times |
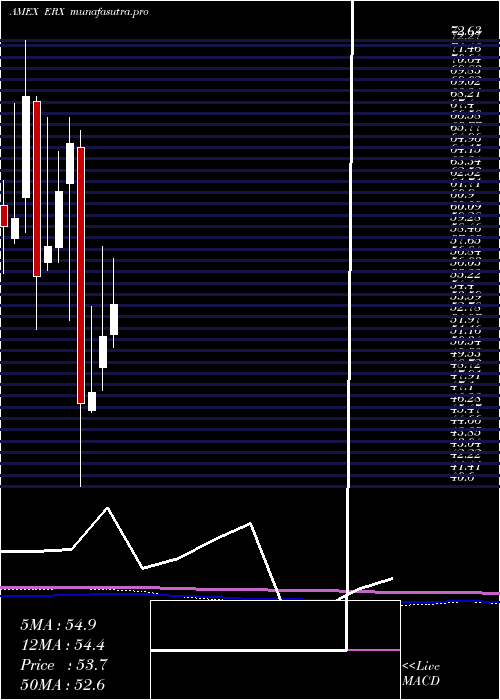
Monthly price and charts EnergyBull Strong monthly Stock price targets for EnergyBull ERX are 48.92 and 55.74 | Monthly Target 1 | 47.09 | | Monthly Target 2 | 50.74 | | Monthly Target 3 | 53.906666666667 | | Monthly Target 4 | 57.56 | | Monthly Target 5 | 60.73 |
Monthly price and volumes Energy Bull
| Date |
Closing |
Open |
Range |
Volume |
Fri 24 October 2025 |
54.40 (-3.49%) |
56.03 |
50.25 - 57.07 |
0.6574 times |
Tue 30 September 2025 |
56.37 (-1.9%) |
57.16 |
52.47 - 60.96 |
1.0071 times |
Fri 29 August 2025 |
57.46 (6.49%) |
53.51 |
50.06 - 57.81 |
0.8846 times |
Thu 31 July 2025 |
53.96 (5.04%) |
51.52 |
50.61 - 56.96 |
1.2759 times |
Mon 30 June 2025 |
51.37 (8.42%) |
49.17 |
47.50 - 57.81 |
1.3841 times |
Fri 30 May 2025 |
47.38 (1.78%) |
46.02 |
45.91 - 53.50 |
0.8186 times |
Wed 30 April 2025 |
46.55 (-28.69%) |
64.93 |
40.60 - 66.18 |
1.1878 times |
Mon 31 March 2025 |
65.28 (5.61%) |
62.36 |
52.55 - 67.11 |
0.763 times |
Fri 28 February 2025 |
61.81 (6.83%) |
57.77 |
56.68 - 64.70 |
0.7699 times |
Fri 31 January 2025 |
57.86 (3.88%) |
56.68 |
56.15 - 67.08 |
1.2517 times |
Tue 31 December 2024 |
55.70 (-18.84%) |
68.27 |
51.90 - 68.59 |
0.9468 times |
DMA SMA EMA moving averages of Energy Bull ERX
DMA (daily moving average) of Energy Bull ERX
| DMA period | DMA value | | 5 day DMA | 53.97 | | 12 day DMA | 52.99 | | 20 day DMA | 54.28 | | 35 day DMA | 55.04 | | 50 day DMA | 54.96 | | 100 day DMA | 53.87 | | 150 day DMA | 52.7 | | 200 day DMA | 54.73 | EMA (exponential moving average) of Energy Bull ERX
| EMA period | EMA current | EMA prev | EMA prev2 | | 5 day EMA | 54.08 | 53.92 | 53.1 | | 12 day EMA | 53.83 | 53.73 | 53.4 | | 20 day EMA | 54.11 | 54.08 | 53.92 | | 35 day EMA | 54.24 | 54.23 | 54.15 | | 50 day EMA | 54.56 | 54.57 | 54.53 |
SMA (simple moving average) of Energy Bull ERX
| SMA period | SMA current | SMA prev | SMA prev2 | | 5 day SMA | 53.97 | 53.48 | 52.61 | | 12 day SMA | 52.99 | 53.11 | 53.18 | | 20 day SMA | 54.28 | 54.56 | 54.71 | | 35 day SMA | 55.04 | 55.01 | 55.02 | | 50 day SMA | 54.96 | 54.9 | 54.83 | | 100 day SMA | 53.87 | 53.81 | 53.73 | | 150 day SMA | 52.7 | 52.76 | 52.82 | | 200 day SMA | 54.73 | 54.75 | 54.77 |
|
|
