PacificEx EPP full analysis,charts,indicators,moving averages,SMA,DMA,EMA,ADX,MACD,RSIPacific Ex EPP WideScreen charts, DMA,SMA,EMA technical analysis, forecast prediction, by indicators ADX,MACD,RSI,CCI AMEX stock exchange
Daily price and charts and targets PacificEx Strong Daily Stock price targets for PacificEx EPP are 51.62 and 51.81 | Daily Target 1 | 51.47 | | Daily Target 2 | 51.57 | | Daily Target 3 | 51.656666666667 | | Daily Target 4 | 51.76 | | Daily Target 5 | 51.85 |
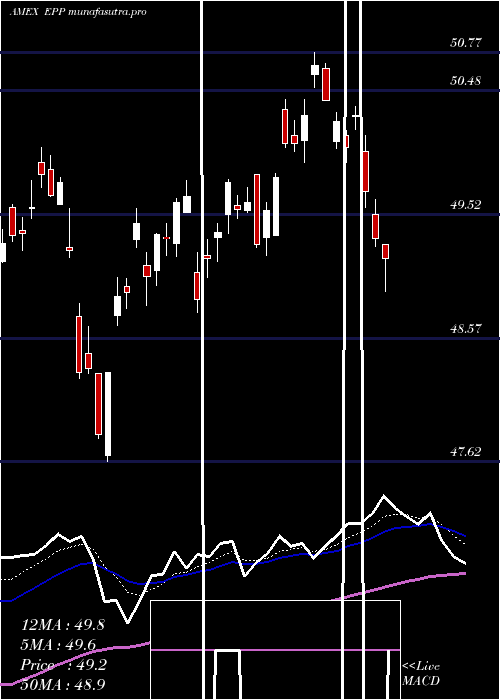
Daily price and volume Pacific Ex
| Date |
Closing |
Open |
Range |
Volume |
Fri 24 October 2025 |
51.68 (0.16%) |
51.66 |
51.55 - 51.74 |
0.3744 times |
Thu 23 October 2025 |
51.60 (0.6%) |
51.46 |
51.44 - 51.72 |
0.5423 times |
Wed 22 October 2025 |
51.29 (-0.37%) |
51.35 |
51.00 - 51.48 |
1.2256 times |
Tue 21 October 2025 |
51.48 (-0.69%) |
51.67 |
51.45 - 51.71 |
0.9175 times |
Mon 20 October 2025 |
51.84 (1.21%) |
51.51 |
51.51 - 51.91 |
0.4379 times |
Fri 17 October 2025 |
51.22 (0.14%) |
50.89 |
50.89 - 51.32 |
0.9407 times |
Thu 16 October 2025 |
51.15 (0%) |
51.58 |
51.05 - 51.64 |
0.9384 times |
Wed 15 October 2025 |
51.15 (0.2%) |
51.31 |
50.95 - 51.50 |
0.7118 times |
Tue 14 October 2025 |
51.05 (-0.14%) |
50.47 |
50.39 - 51.28 |
1.8457 times |
Mon 13 October 2025 |
51.12 (1.15%) |
51.03 |
50.92 - 51.20 |
2.0656 times |
Fri 10 October 2025 |
50.54 (-2.13%) |
51.82 |
50.46 - 51.95 |
2.5121 times |
Weekly price and charts PacificEx Strong weekly Stock price targets for PacificEx EPP are 51.34 and 52.25 | Weekly Target 1 | 50.62 | | Weekly Target 2 | 51.15 | | Weekly Target 3 | 51.53 | | Weekly Target 4 | 52.06 | | Weekly Target 5 | 52.44 |
Weekly price and volumes for Pacific Ex
| Date |
Closing |
Open |
Range |
Volume |
Fri 24 October 2025 |
51.68 (0.9%) |
51.51 |
51.00 - 51.91 |
0.5627 times |
Fri 17 October 2025 |
51.22 (1.35%) |
51.03 |
50.39 - 51.64 |
1.0461 times |
Fri 10 October 2025 |
50.54 (-3.44%) |
52.26 |
50.46 - 52.49 |
1.4076 times |
Fri 03 October 2025 |
52.34 (2.61%) |
51.40 |
51.36 - 52.52 |
1.6058 times |
Fri 26 September 2025 |
51.01 (-1.03%) |
51.44 |
50.42 - 51.64 |
0.9122 times |
Fri 19 September 2025 |
51.54 (-1.58%) |
52.67 |
51.38 - 52.72 |
1.4442 times |
Fri 12 September 2025 |
52.37 (1.85%) |
51.71 |
51.51 - 52.69 |
1.2939 times |
Fri 05 September 2025 |
51.42 (-0.25%) |
50.81 |
50.71 - 51.77 |
1.0198 times |
Fri 29 August 2025 |
51.55 (0%) |
51.51 |
51.44 - 51.64 |
0.1426 times |
Fri 29 August 2025 |
51.55 (-0.79%) |
51.48 |
51.01 - 51.64 |
0.5649 times |
Fri 22 August 2025 |
51.96 (1.7%) |
51.07 |
50.68 - 51.99 |
1.0105 times |

Monthly price and charts PacificEx Strong monthly Stock price targets for PacificEx EPP are 49.97 and 52.1 | Monthly Target 1 | 49.4 | | Monthly Target 2 | 50.54 | | Monthly Target 3 | 51.53 | | Monthly Target 4 | 52.67 | | Monthly Target 5 | 53.66 |
Monthly price and volumes Pacific Ex
| Date |
Closing |
Open |
Range |
Volume |
Fri 24 October 2025 |
51.68 (0.23%) |
51.73 |
50.39 - 52.52 |
0.5773 times |
Tue 30 September 2025 |
51.56 (0.02%) |
50.81 |
50.42 - 52.72 |
0.7501 times |
Fri 29 August 2025 |
51.55 (4.48%) |
49.29 |
48.93 - 51.99 |
0.6372 times |
Thu 31 July 2025 |
49.34 (-0.06%) |
49.35 |
48.77 - 50.77 |
1.3786 times |
Mon 30 June 2025 |
49.37 (2.3%) |
48.56 |
47.62 - 50.04 |
0.5216 times |
Fri 30 May 2025 |
48.26 (5.44%) |
45.80 |
45.66 - 48.51 |
1.3988 times |
Wed 30 April 2025 |
45.77 (3.79%) |
44.36 |
38.44 - 45.89 |
1.8599 times |
Mon 31 March 2025 |
44.10 (-1.45%) |
45.30 |
43.50 - 45.87 |
1.1226 times |
Fri 28 February 2025 |
44.75 (-0.2%) |
44.20 |
44.16 - 46.64 |
0.9651 times |
Fri 31 January 2025 |
44.84 (2.35%) |
43.95 |
42.95 - 45.59 |
0.7888 times |
Tue 31 December 2024 |
43.81 (-6.23%) |
47.59 |
43.24 - 47.90 |
0.6203 times |

DMA SMA EMA moving averages of Pacific Ex EPP
DMA (daily moving average) of Pacific Ex EPP
| DMA period | DMA value | | 5 day DMA | 51.58 | | 12 day DMA | 51.31 | | 20 day DMA | 51.59 | | 35 day DMA | 51.66 | | 50 day DMA | 51.54 | | 100 day DMA | 50.61 | | 150 day DMA | 48.82 | | 200 day DMA | 47.84 | EMA (exponential moving average) of Pacific Ex EPP
| EMA period | EMA current | EMA prev | EMA prev2 | | 5 day EMA | 51.53 | 51.46 | 51.39 | | 12 day EMA | 51.49 | 51.46 | 51.43 | | 20 day EMA | 51.51 | 51.49 | 51.48 | | 35 day EMA | 51.52 | 51.51 | 51.5 | | 50 day EMA | 51.5 | 51.49 | 51.49 |
SMA (simple moving average) of Pacific Ex EPP
| SMA period | SMA current | SMA prev | SMA prev2 | | 5 day SMA | 51.58 | 51.49 | 51.4 | | 12 day SMA | 51.31 | 51.36 | 51.4 | | 20 day SMA | 51.59 | 51.56 | 51.51 | | 35 day SMA | 51.66 | 51.65 | 51.64 | | 50 day SMA | 51.54 | 51.53 | 51.52 | | 100 day SMA | 50.61 | 50.58 | 50.55 | | 150 day SMA | 48.82 | 48.77 | 48.72 | | 200 day SMA | 47.84 | 47.8 | 47.77 |
|
|
