EgsharesEmerging EMCR full analysis,charts,indicators,moving averages,SMA,DMA,EMA,ADX,MACD,RSIEgshares Emerging EMCR WideScreen charts, DMA,SMA,EMA technical analysis, forecast prediction, by indicators ADX,MACD,RSI,CCI AMEX stock exchange
Daily price and charts and targets EgsharesEmerging Strong Daily Stock price targets for EgsharesEmerging EMCR are 36.94 and 36.94 | Daily Target 1 | 36.94 | | Daily Target 2 | 36.94 | | Daily Target 3 | 36.94 | | Daily Target 4 | 36.94 | | Daily Target 5 | 36.94 |
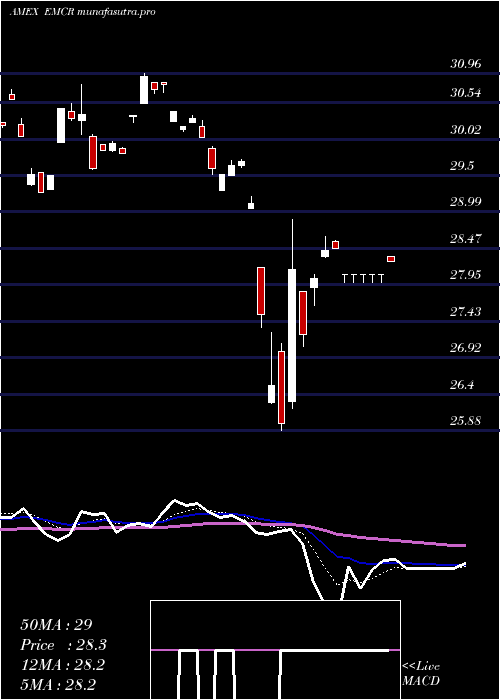
Daily price and volume Egshares Emerging
| Date |
Closing |
Open |
Range |
Volume |
Thu 23 October 2025 |
36.94 (0.46%) |
36.94 |
36.94 - 36.94 |
0.0058 times |
Wed 22 October 2025 |
36.77 (-0.57%) |
36.89 |
36.65 - 36.99 |
0.1613 times |
Tue 21 October 2025 |
36.98 (-0.7%) |
37.03 |
36.93 - 37.03 |
0.1439 times |
Mon 20 October 2025 |
37.24 (1.2%) |
36.86 |
36.86 - 37.29 |
0.0876 times |
Fri 17 October 2025 |
36.80 (0.05%) |
36.81 |
36.80 - 36.81 |
0.0423 times |
Thu 16 October 2025 |
36.78 (0.74%) |
36.49 |
36.49 - 37.05 |
9.1233 times |
Wed 15 October 2025 |
36.51 (1.19%) |
36.54 |
36.51 - 36.54 |
0.0846 times |
Tue 14 October 2025 |
36.08 (-0.47%) |
35.74 |
35.74 - 36.12 |
0.1904 times |
Mon 13 October 2025 |
36.25 (-1.41%) |
36.22 |
36.21 - 36.34 |
0.0635 times |
Tue 07 October 2025 |
36.77 (-0.62%) |
37.03 |
36.76 - 37.03 |
0.0973 times |
Mon 06 October 2025 |
37.00 (0.38%) |
37.05 |
37.00 - 37.05 |
0.0111 times |
Weekly price and charts EgsharesEmerging Strong weekly Stock price targets for EgsharesEmerging EMCR are 36.8 and 37.44 | Weekly Target 1 | 36.32 | | Weekly Target 2 | 36.63 | | Weekly Target 3 | 36.96 | | Weekly Target 4 | 37.27 | | Weekly Target 5 | 37.6 |
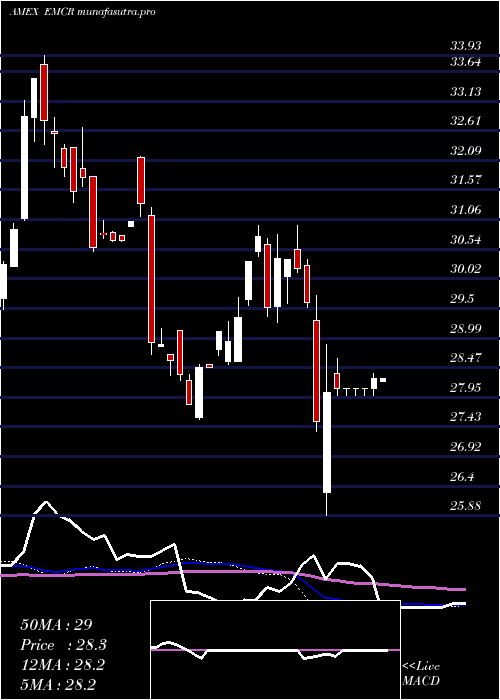
Weekly price and volumes for Egshares Emerging
| Date |
Closing |
Open |
Range |
Volume |
Thu 23 October 2025 |
36.94 (0.38%) |
36.86 |
36.65 - 37.29 |
0.2829 times |
Fri 17 October 2025 |
36.80 (0.08%) |
36.22 |
35.74 - 37.05 |
6.7459 times |
Tue 07 October 2025 |
36.77 (-0.24%) |
37.05 |
36.76 - 37.05 |
0.077 times |
Fri 03 October 2025 |
36.86 (3.16%) |
36.11 |
35.99 - 36.92 |
0.7107 times |
Fri 26 September 2025 |
35.73 (-0.67%) |
35.99 |
35.51 - 36.26 |
0.1382 times |
Fri 19 September 2025 |
35.97 (1.52%) |
35.99 |
35.60 - 36.50 |
0.3454 times |
Fri 12 September 2025 |
35.43 (3.75%) |
34.31 |
34.31 - 35.51 |
0.2553 times |
Fri 05 September 2025 |
34.15 (0.77%) |
33.71 |
33.69 - 34.15 |
0.1322 times |
Fri 29 August 2025 |
33.89 (0%) |
33.92 |
33.89 - 33.92 |
0.021 times |
Fri 29 August 2025 |
33.89 (-1.05%) |
34.28 |
33.62 - 34.28 |
1.2915 times |
Fri 22 August 2025 |
34.25 (1.33%) |
34.17 |
33.58 - 34.25 |
0.1472 times |
Monthly price and charts EgsharesEmerging Strong monthly Stock price targets for EgsharesEmerging EMCR are 36.34 and 37.89 | Monthly Target 1 | 35.11 | | Monthly Target 2 | 36.02 | | Monthly Target 3 | 36.656666666667 | | Monthly Target 4 | 37.57 | | Monthly Target 5 | 38.21 |
Monthly price and volumes Egshares Emerging
| Date |
Closing |
Open |
Range |
Volume |
Thu 23 October 2025 |
36.94 (1.79%) |
36.76 |
35.74 - 37.29 |
1.9792 times |
Tue 30 September 2025 |
36.29 (7.08%) |
33.71 |
33.69 - 36.50 |
0.3278 times |
Fri 29 August 2025 |
33.89 (3.45%) |
32.57 |
32.40 - 34.28 |
0.5727 times |
Thu 31 July 2025 |
32.76 (1.17%) |
32.47 |
32.12 - 33.57 |
0.2384 times |
Mon 30 June 2025 |
32.38 (4.79%) |
30.98 |
30.94 - 32.57 |
0.3384 times |
Fri 30 May 2025 |
30.90 (4.32%) |
29.66 |
29.61 - 31.57 |
1.5485 times |
Wed 30 April 2025 |
29.62 (0.34%) |
29.51 |
25.88 - 29.73 |
1.3168 times |
Mon 31 March 2025 |
29.52 (0%) |
29.54 |
29.26 - 30.96 |
1.0388 times |
Fri 28 February 2025 |
29.52 (2.04%) |
28.58 |
28.58 - 30.96 |
1.4995 times |
Fri 31 January 2025 |
28.93 (1.47%) |
28.50 |
27.56 - 29.28 |
1.1399 times |
Tue 31 December 2024 |
28.51 (-7.1%) |
30.94 |
28.45 - 32.16 |
2.4987 times |

DMA SMA EMA moving averages of Egshares Emerging EMCR
DMA (daily moving average) of Egshares Emerging EMCR
| DMA period | DMA value | | 5 day DMA | 36.95 | | 12 day DMA | 36.75 | | 20 day DMA | 36.52 | | 35 day DMA | 35.92 | | 50 day DMA | 35.31 | | 100 day DMA | 33.87 | | 150 day DMA | 32.44 | | 200 day DMA | 31.68 | EMA (exponential moving average) of Egshares Emerging EMCR
| EMA period | EMA current | EMA prev | EMA prev2 | | 5 day EMA | 36.87 | 36.84 | 36.88 | | 12 day EMA | 36.72 | 36.68 | 36.66 | | 20 day EMA | 36.46 | 36.41 | 36.37 | | 35 day EMA | 35.88 | 35.82 | 35.76 | | 50 day EMA | 35.3 | 35.23 | 35.17 |
SMA (simple moving average) of Egshares Emerging EMCR
| SMA period | SMA current | SMA prev | SMA prev2 | | 5 day SMA | 36.95 | 36.91 | 36.86 | | 12 day SMA | 36.75 | 36.73 | 36.71 | | 20 day SMA | 36.52 | 36.48 | 36.44 | | 35 day SMA | 35.92 | 35.83 | 35.75 | | 50 day SMA | 35.31 | 35.24 | 35.17 | | 100 day SMA | 33.87 | 33.81 | 33.75 | | 150 day SMA | 32.44 | 32.4 | 32.36 | | 200 day SMA | 31.68 | 31.64 | 31.59 |
|
|
