IsraelCap EIS full analysis,charts,indicators,moving averages,SMA,DMA,EMA,ADX,MACD,RSIIsrael Cap EIS WideScreen charts, DMA,SMA,EMA technical analysis, forecast prediction, by indicators ADX,MACD,RSI,CCI AMEX stock exchange
Daily price and charts and targets IsraelCap Strong Daily Stock price targets for IsraelCap EIS are 99.74 and 100.47 | Daily Target 1 | 99.61 | | Daily Target 2 | 99.86 | | Daily Target 3 | 100.34333333333 | | Daily Target 4 | 100.59 | | Daily Target 5 | 101.07 |
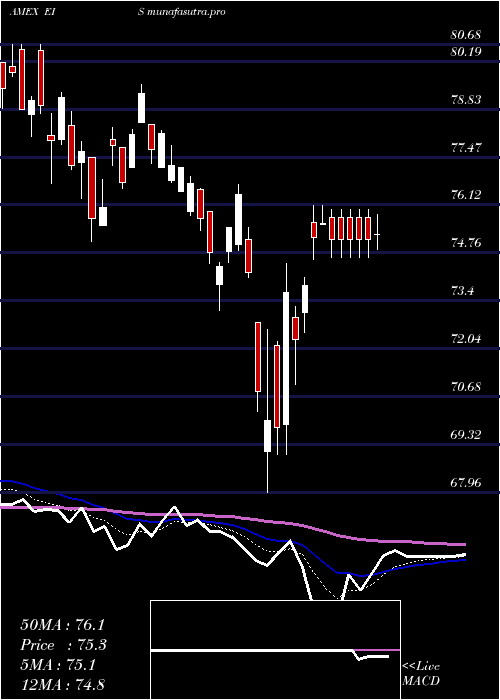
Daily price and volume Israel Cap
| Date |
Closing |
Open |
Range |
Volume |
Fri 24 October 2025 |
100.10 (0.31%) |
100.41 |
100.10 - 100.83 |
0.4511 times |
Thu 23 October 2025 |
99.79 (1.16%) |
98.34 |
98.34 - 99.98 |
0.6093 times |
Wed 22 October 2025 |
98.65 (-0.06%) |
98.70 |
97.79 - 99.12 |
0.2235 times |
Tue 21 October 2025 |
98.71 (-0.74%) |
98.88 |
98.37 - 99.10 |
0.4874 times |
Mon 20 October 2025 |
99.45 (1.2%) |
98.95 |
98.51 - 99.50 |
0.4463 times |
Fri 17 October 2025 |
98.27 (0.4%) |
96.89 |
96.89 - 98.50 |
0.3593 times |
Thu 16 October 2025 |
97.88 (-1.67%) |
99.93 |
97.56 - 99.93 |
2.1554 times |
Wed 15 October 2025 |
99.54 (-1.28%) |
100.46 |
99.19 - 100.75 |
1.7756 times |
Tue 14 October 2025 |
100.83 (-0.69%) |
100.84 |
99.58 - 101.79 |
1.4426 times |
Mon 13 October 2025 |
101.53 (2.04%) |
102.08 |
100.89 - 102.36 |
2.0496 times |
Fri 10 October 2025 |
99.50 (-2.69%) |
102.45 |
99.31 - 102.45 |
1.6182 times |
Weekly price and charts IsraelCap Strong weekly Stock price targets for IsraelCap EIS are 98.95 and 101.99 | Weekly Target 1 | 96.53 | | Weekly Target 2 | 98.32 | | Weekly Target 3 | 99.573333333333 | | Weekly Target 4 | 101.36 | | Weekly Target 5 | 102.61 |
Weekly price and volumes for Israel Cap
| Date |
Closing |
Open |
Range |
Volume |
Fri 24 October 2025 |
100.10 (1.86%) |
98.95 |
97.79 - 100.83 |
0.6146 times |
Fri 17 October 2025 |
98.27 (-1.24%) |
102.08 |
96.89 - 102.36 |
2.1568 times |
Fri 10 October 2025 |
99.50 (-0.62%) |
101.00 |
99.31 - 103.27 |
1.502 times |
Fri 03 October 2025 |
100.12 (5.79%) |
97.42 |
97.17 - 102.00 |
2.1227 times |
Fri 26 September 2025 |
94.64 (-0.68%) |
94.49 |
93.77 - 95.11 |
0.537 times |
Fri 19 September 2025 |
95.29 (-1.81%) |
96.02 |
93.34 - 96.21 |
0.6452 times |
Fri 12 September 2025 |
97.05 (2.1%) |
96.44 |
96.37 - 98.35 |
0.4052 times |
Fri 05 September 2025 |
95.05 (0.28%) |
91.95 |
91.14 - 95.66 |
0.4426 times |
Fri 29 August 2025 |
94.78 (0%) |
95.00 |
94.54 - 95.10 |
0.073 times |
Fri 29 August 2025 |
94.78 (2.35%) |
92.93 |
92.93 - 95.61 |
1.501 times |
Fri 22 August 2025 |
92.60 (1.88%) |
91.42 |
89.97 - 92.89 |
0.503 times |

Monthly price and charts IsraelCap Strong monthly Stock price targets for IsraelCap EIS are 95.31 and 101.69 | Monthly Target 1 | 93.71 | | Monthly Target 2 | 96.9 | | Monthly Target 3 | 100.08666666667 | | Monthly Target 4 | 103.28 | | Monthly Target 5 | 106.47 |
Monthly price and volumes Israel Cap
| Date |
Closing |
Open |
Range |
Volume |
Fri 24 October 2025 |
100.10 (-0.2%) |
100.41 |
96.89 - 103.27 |
1.0015 times |
Tue 30 September 2025 |
100.30 (5.82%) |
91.95 |
91.14 - 100.38 |
0.6974 times |
Fri 29 August 2025 |
94.78 (3.22%) |
91.38 |
87.00 - 95.61 |
0.978 times |
Thu 31 July 2025 |
91.82 (-3.23%) |
94.59 |
91.77 - 97.83 |
1.2543 times |
Mon 30 June 2025 |
94.88 (11.93%) |
84.40 |
81.90 - 94.90 |
1.1378 times |
Fri 30 May 2025 |
84.77 (8.17%) |
78.92 |
78.65 - 85.49 |
0.4067 times |
Wed 30 April 2025 |
78.37 (5.39%) |
74.80 |
67.96 - 78.51 |
0.4468 times |
Mon 31 March 2025 |
74.36 (-5.96%) |
80.51 |
73.12 - 80.67 |
1.5922 times |
Fri 28 February 2025 |
79.07 (-1.93%) |
79.64 |
78.06 - 84.00 |
1.294 times |
Fri 31 January 2025 |
80.63 (4.65%) |
77.19 |
76.00 - 82.71 |
1.1913 times |
Tue 31 December 2024 |
77.05 (3.23%) |
74.90 |
74.90 - 77.99 |
0.573 times |

DMA SMA EMA moving averages of Israel Cap EIS
DMA (daily moving average) of Israel Cap EIS
| DMA period | DMA value | | 5 day DMA | 99.34 | | 12 day DMA | 99.71 | | 20 day DMA | 99.8 | | 35 day DMA | 98.01 | | 50 day DMA | 96.6 | | 100 day DMA | 93.95 | | 150 day DMA | 88.7 | | 200 day DMA | 86.51 | EMA (exponential moving average) of Israel Cap EIS
| EMA period | EMA current | EMA prev | EMA prev2 | | 5 day EMA | 99.51 | 99.21 | 98.92 | | 12 day EMA | 99.37 | 99.24 | 99.14 | | 20 day EMA | 98.94 | 98.82 | 98.72 | | 35 day EMA | 97.81 | 97.67 | 97.55 | | 50 day EMA | 96.3 | 96.14 | 95.99 |
SMA (simple moving average) of Israel Cap EIS
| SMA period | SMA current | SMA prev | SMA prev2 | | 5 day SMA | 99.34 | 98.97 | 98.59 | | 12 day SMA | 99.71 | 99.75 | 99.76 | | 20 day SMA | 99.8 | 99.53 | 99.25 | | 35 day SMA | 98.01 | 97.87 | 97.72 | | 50 day SMA | 96.6 | 96.42 | 96.23 | | 100 day SMA | 93.95 | 93.8 | 93.65 | | 150 day SMA | 88.7 | 88.55 | 88.4 | | 200 day SMA | 86.51 | 86.4 | 86.29 |
|
|
