VaneckVectors EINC full analysis,charts,indicators,moving averages,SMA,DMA,EMA,ADX,MACD,RSIVaneck Vectors EINC WideScreen charts, DMA,SMA,EMA technical analysis, forecast prediction, by indicators ADX,MACD,RSI,CCI AMEX stock exchange
Daily price and charts and targets VaneckVectors Strong Daily Stock price targets for VaneckVectors EINC are 94.11 and 94.92 | Daily Target 1 | 93.89 | | Daily Target 2 | 94.32 | | Daily Target 3 | 94.7 | | Daily Target 4 | 95.13 | | Daily Target 5 | 95.51 |
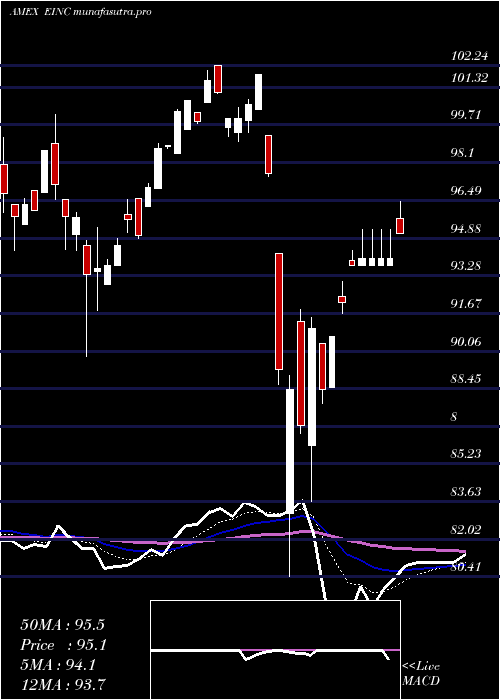
Daily price and volume Vaneck Vectors
| Date |
Closing |
Open |
Range |
Volume |
Thu 23 October 2025 |
94.75 (-0.31%) |
95.08 |
94.27 - 95.08 |
1.6441 times |
Wed 22 October 2025 |
95.04 (0.99%) |
94.59 |
94.34 - 95.18 |
1.1498 times |
Tue 21 October 2025 |
94.11 (-0.14%) |
93.15 |
93.15 - 94.19 |
0.7252 times |
Mon 20 October 2025 |
94.24 (0.77%) |
93.82 |
93.82 - 94.36 |
0.7008 times |
Fri 17 October 2025 |
93.52 (0.04%) |
92.81 |
92.81 - 93.52 |
0.4888 times |
Thu 16 October 2025 |
93.48 (-1.32%) |
94.56 |
93.08 - 94.56 |
2.1045 times |
Wed 15 October 2025 |
94.73 (0.34%) |
94.77 |
94.65 - 95.57 |
0.967 times |
Tue 14 October 2025 |
94.41 (-0.5%) |
94.00 |
93.67 - 95.10 |
0.7692 times |
Mon 13 October 2025 |
94.88 (0.13%) |
94.84 |
94.73 - 95.06 |
0.7692 times |
Fri 10 October 2025 |
94.76 (-1.57%) |
96.25 |
94.54 - 96.25 |
0.6813 times |
Thu 09 October 2025 |
96.27 (-2.08%) |
98.19 |
96.27 - 98.19 |
0.3736 times |
Weekly price and charts VaneckVectors Strong weekly Stock price targets for VaneckVectors EINC are 93.95 and 95.98 | Weekly Target 1 | 92.33 | | Weekly Target 2 | 93.54 | | Weekly Target 3 | 94.36 | | Weekly Target 4 | 95.57 | | Weekly Target 5 | 96.39 |
Weekly price and volumes for Vaneck Vectors
| Date |
Closing |
Open |
Range |
Volume |
Thu 23 October 2025 |
94.75 (1.32%) |
93.82 |
93.15 - 95.18 |
1.5302 times |
Fri 17 October 2025 |
93.52 (-1.31%) |
94.84 |
92.81 - 95.57 |
1.8488 times |
Fri 10 October 2025 |
94.76 (-4.4%) |
99.14 |
94.54 - 99.14 |
1.3207 times |
Fri 03 October 2025 |
99.12 (-0.68%) |
98.84 |
98.28 - 99.60 |
1.0368 times |
Fri 26 September 2025 |
99.80 (2.76%) |
96.14 |
96.14 - 100.19 |
0.5339 times |
Fri 19 September 2025 |
97.12 (-0.1%) |
96.86 |
96.54 - 98.02 |
1.1396 times |
Fri 12 September 2025 |
97.22 (1%) |
95.41 |
95.02 - 97.22 |
0.8925 times |
Fri 05 September 2025 |
96.26 (-1.1%) |
97.00 |
95.24 - 97.24 |
0.5578 times |
Fri 29 August 2025 |
97.33 (0%) |
96.91 |
96.91 - 97.70 |
0.1355 times |
Fri 29 August 2025 |
97.33 (0.98%) |
96.64 |
95.35 - 97.70 |
1.0041 times |
Fri 22 August 2025 |
96.39 (1.12%) |
94.68 |
94.30 - 96.68 |
0.9244 times |

Monthly price and charts VaneckVectors Strong monthly Stock price targets for VaneckVectors EINC are 90.39 and 97.18 | Monthly Target 1 | 88.93 | | Monthly Target 2 | 91.84 | | Monthly Target 3 | 95.72 | | Monthly Target 4 | 98.63 | | Monthly Target 5 | 102.51 |
Monthly price and volumes Vaneck Vectors
| Date |
Closing |
Open |
Range |
Volume |
Thu 23 October 2025 |
94.75 (-4.45%) |
98.59 |
92.81 - 99.60 |
0.6053 times |
Tue 30 September 2025 |
99.16 (1.88%) |
97.00 |
95.02 - 100.19 |
0.4039 times |
Fri 29 August 2025 |
97.33 (-0.47%) |
95.35 |
94.30 - 97.70 |
0.8714 times |
Thu 31 July 2025 |
97.79 (-0.92%) |
98.34 |
94.71 - 98.34 |
1.3532 times |
Mon 30 June 2025 |
98.70 (2.65%) |
96.61 |
95.79 - 98.80 |
0.5946 times |
Fri 30 May 2025 |
96.15 (1.6%) |
92.97 |
92.97 - 96.91 |
0.8868 times |
Wed 30 April 2025 |
94.64 (-5.34%) |
99.90 |
80.41 - 101.85 |
1.1416 times |
Mon 31 March 2025 |
99.98 (1.38%) |
98.92 |
89.81 - 102.24 |
1.0487 times |
Fri 28 February 2025 |
98.62 (1.5%) |
95.32 |
94.33 - 100.42 |
0.9894 times |
Fri 31 January 2025 |
97.16 (3.32%) |
95.70 |
94.91 - 104.70 |
2.105 times |
Tue 31 December 2024 |
94.04 (-4.66%) |
98.25 |
84.97 - 99.12 |
1.792 times |

DMA SMA EMA moving averages of Vaneck Vectors EINC
DMA (daily moving average) of Vaneck Vectors EINC
| DMA period | DMA value | | 5 day DMA | 94.33 | | 12 day DMA | 94.88 | | 20 day DMA | 96.47 | | 35 day DMA | 96.78 | | 50 day DMA | 96.62 | | 100 day DMA | 96.63 | | 150 day DMA | 96.19 | | 200 day DMA | 96.65 | EMA (exponential moving average) of Vaneck Vectors EINC
| EMA period | EMA current | EMA prev | EMA prev2 | | 5 day EMA | 94.58 | 94.49 | 94.22 | | 12 day EMA | 95.11 | 95.17 | 95.19 | | 20 day EMA | 95.7 | 95.8 | 95.88 | | 35 day EMA | 96.08 | 96.16 | 96.23 | | 50 day EMA | 96.33 | 96.39 | 96.44 |
SMA (simple moving average) of Vaneck Vectors EINC
| SMA period | SMA current | SMA prev | SMA prev2 | | 5 day SMA | 94.33 | 94.08 | 94.02 | | 12 day SMA | 94.88 | 95.17 | 95.45 | | 20 day SMA | 96.47 | 96.71 | 96.92 | | 35 day SMA | 96.78 | 96.84 | 96.88 | | 50 day SMA | 96.62 | 96.65 | 96.67 | | 100 day SMA | 96.63 | 96.64 | 96.65 | | 150 day SMA | 96.19 | 96.22 | 96.25 | | 200 day SMA | 96.65 | 96.66 | 96.66 |
|
|
