UltrashortMsci EFU full analysis,charts,indicators,moving averages,SMA,DMA,EMA,ADX,MACD,RSIUltrashort Msci EFU WideScreen charts, DMA,SMA,EMA technical analysis, forecast prediction, by indicators ADX,MACD,RSI,CCI AMEX stock exchange
Daily price and charts and targets UltrashortMsci Strong Daily Stock price targets for UltrashortMsci EFU are 9.65 and 9.65 | Daily Target 1 | 9.63 | | Daily Target 2 | 9.63 | | Daily Target 3 | 9.6333333333333 | | Daily Target 4 | 9.67 | | Daily Target 5 | 9.67 |
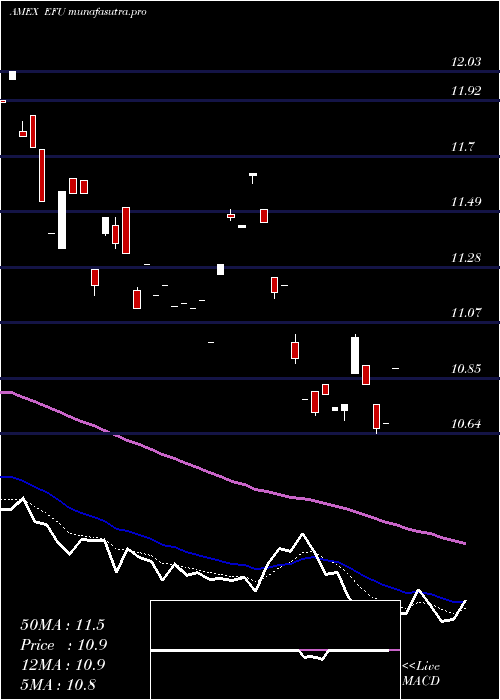
Daily price and volume Ultrashort Msci
| Date |
Closing |
Open |
Range |
Volume |
Thu 23 October 2025 |
9.70 (0%) |
9.60 |
9.60 - 9.60 |
0 times |
Wed 22 October 2025 |
9.70 (0.52%) |
9.68 |
9.68 - 9.70 |
6.3702 times |
Tue 21 October 2025 |
9.65 (1.58%) |
9.65 |
9.65 - 9.65 |
0.0728 times |
Mon 20 October 2025 |
9.50 (-1.76%) |
9.58 |
9.50 - 9.58 |
1.2675 times |
Fri 17 October 2025 |
9.67 (-0.31%) |
9.73 |
9.67 - 9.73 |
0.177 times |
Thu 16 October 2025 |
9.70 (-1.22%) |
9.70 |
9.70 - 9.70 |
0 times |
Wed 15 October 2025 |
9.82 (-0.61%) |
9.82 |
9.82 - 9.83 |
0.5463 times |
Tue 14 October 2025 |
9.88 (-1.1%) |
9.88 |
9.88 - 9.88 |
0.0364 times |
Mon 13 October 2025 |
9.99 (-1.58%) |
10.05 |
9.98 - 10.05 |
1.0198 times |
Fri 10 October 2025 |
10.15 (3.68%) |
10.15 |
10.15 - 10.15 |
0.5099 times |
Thu 09 October 2025 |
9.79 (1.87%) |
9.67 |
9.67 - 9.79 |
6.5195 times |
Weekly price and charts UltrashortMsci Strong weekly Stock price targets for UltrashortMsci EFU are 9.6 and 9.8 | Weekly Target 1 | 9.43 | | Weekly Target 2 | 9.57 | | Weekly Target 3 | 9.6333333333333 | | Weekly Target 4 | 9.77 | | Weekly Target 5 | 9.83 |
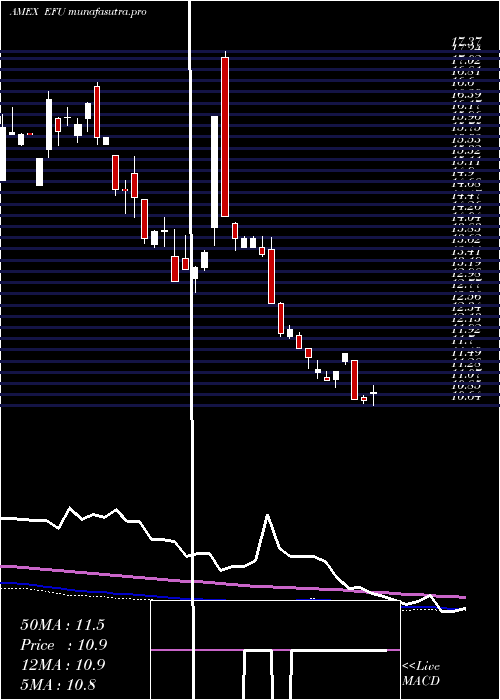
Weekly price and volumes for Ultrashort Msci
| Date |
Closing |
Open |
Range |
Volume |
Thu 23 October 2025 |
9.70 (0.31%) |
9.58 |
9.50 - 9.70 |
2.955 times |
Fri 17 October 2025 |
9.67 (-4.73%) |
10.05 |
9.67 - 10.05 |
0.682 times |
Fri 10 October 2025 |
10.15 (6.39%) |
9.54 |
9.49 - 10.15 |
2.8454 times |
Fri 03 October 2025 |
9.54 (-4.98%) |
9.97 |
9.54 - 9.97 |
0.1815 times |
Fri 26 September 2025 |
10.04 (-0.5%) |
10.10 |
10.02 - 10.19 |
1.1167 times |
Fri 19 September 2025 |
10.09 (0.2%) |
10.00 |
9.96 - 10.15 |
0.656 times |
Fri 12 September 2025 |
10.07 (-2.42%) |
10.11 |
9.99 - 10.21 |
0.8515 times |
Fri 05 September 2025 |
10.32 (-0.58%) |
10.70 |
10.32 - 10.70 |
0.1815 times |
Fri 29 August 2025 |
10.38 (0%) |
10.38 |
10.38 - 10.38 |
0.0558 times |
Fri 29 August 2025 |
10.38 (4.01%) |
10.23 |
10.23 - 10.38 |
0.4746 times |
Fri 22 August 2025 |
9.98 (-2.06%) |
10.26 |
9.92 - 10.27 |
0.4606 times |
Monthly price and charts UltrashortMsci Strong monthly Stock price targets for UltrashortMsci EFU are 9.27 and 9.93 | Monthly Target 1 | 9.12 | | Monthly Target 2 | 9.41 | | Monthly Target 3 | 9.78 | | Monthly Target 4 | 10.07 | | Monthly Target 5 | 10.44 |
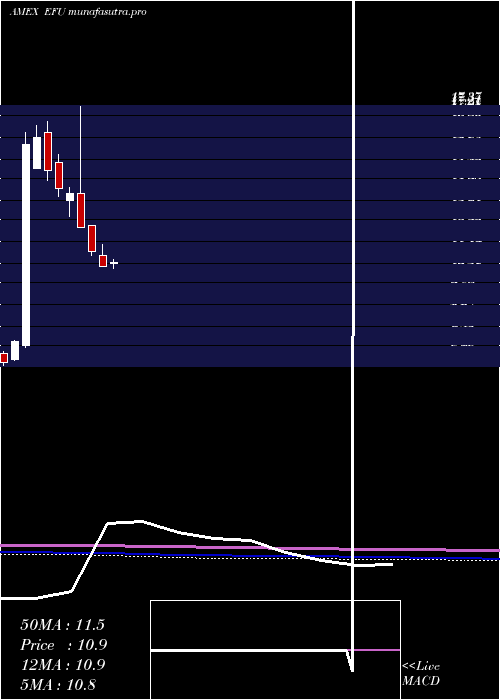
Monthly price and volumes Ultrashort Msci
| Date |
Closing |
Open |
Range |
Volume |
Thu 23 October 2025 |
9.70 (-1.72%) |
9.77 |
9.49 - 10.15 |
0.5458 times |
Tue 30 September 2025 |
9.87 (-4.91%) |
10.70 |
9.87 - 10.70 |
0.233 times |
Fri 29 August 2025 |
10.38 (-7.98%) |
11.37 |
9.92 - 11.45 |
0.2606 times |
Thu 31 July 2025 |
11.28 (5.22%) |
10.83 |
10.28 - 11.29 |
0.8322 times |
Mon 30 June 2025 |
10.72 (-5.38%) |
11.19 |
10.71 - 11.64 |
0.4053 times |
Fri 30 May 2025 |
11.33 (-8.33%) |
12.42 |
11.17 - 12.44 |
0.4328 times |
Wed 30 April 2025 |
12.36 (-10.24%) |
13.75 |
12.33 - 17.37 |
2.0227 times |
Mon 31 March 2025 |
13.77 (-1.43%) |
13.47 |
12.79 - 14.02 |
2.2933 times |
Fri 28 February 2025 |
13.97 (-5.16%) |
15.05 |
13.65 - 15.38 |
1.272 times |
Fri 31 January 2025 |
14.73 (-8.4%) |
16.30 |
14.29 - 16.77 |
1.7023 times |
Tue 31 December 2024 |
16.08 (1.77%) |
14.82 |
14.82 - 16.61 |
0.4335 times |
DMA SMA EMA moving averages of Ultrashort Msci EFU
DMA (daily moving average) of Ultrashort Msci EFU
| DMA period | DMA value | | 5 day DMA | 9.64 | | 12 day DMA | 9.76 | | 20 day DMA | 9.76 | | 35 day DMA | 9.9 | | 50 day DMA | 10.02 | | 100 day DMA | 10.48 | | 150 day DMA | 11.31 | | 200 day DMA | 12.08 | EMA (exponential moving average) of Ultrashort Msci EFU
| EMA period | EMA current | EMA prev | EMA prev2 | | 5 day EMA | 9.68 | 9.67 | 9.66 | | 12 day EMA | 9.73 | 9.73 | 9.74 | | 20 day EMA | 9.78 | 9.79 | 9.8 | | 35 day EMA | 9.9 | 9.91 | 9.92 | | 50 day EMA | 10.02 | 10.03 | 10.04 |
SMA (simple moving average) of Ultrashort Msci EFU
| SMA period | SMA current | SMA prev | SMA prev2 | | 5 day SMA | 9.64 | 9.64 | 9.67 | | 12 day SMA | 9.76 | 9.76 | 9.74 | | 20 day SMA | 9.76 | 9.78 | 9.8 | | 35 day SMA | 9.9 | 9.92 | 9.95 | | 50 day SMA | 10.02 | 10.03 | 10.04 | | 100 day SMA | 10.48 | 10.5 | 10.51 | | 150 day SMA | 11.31 | 11.33 | 11.35 | | 200 day SMA | 12.08 | 12.11 | 12.14 |
|
|
