EafeIndex EFA full analysis,charts,indicators,moving averages,SMA,DMA,EMA,ADX,MACD,RSIEafe Index EFA WideScreen charts, DMA,SMA,EMA technical analysis, forecast prediction, by indicators ADX,MACD,RSI,CCI AMEX stock exchange
Daily price and charts and targets EafeIndex Strong Daily Stock price targets for EafeIndex EFA are 94.72 and 95.16 | Daily Target 1 | 94.37 | | Daily Target 2 | 94.62 | | Daily Target 3 | 94.81 | | Daily Target 4 | 95.06 | | Daily Target 5 | 95.25 |
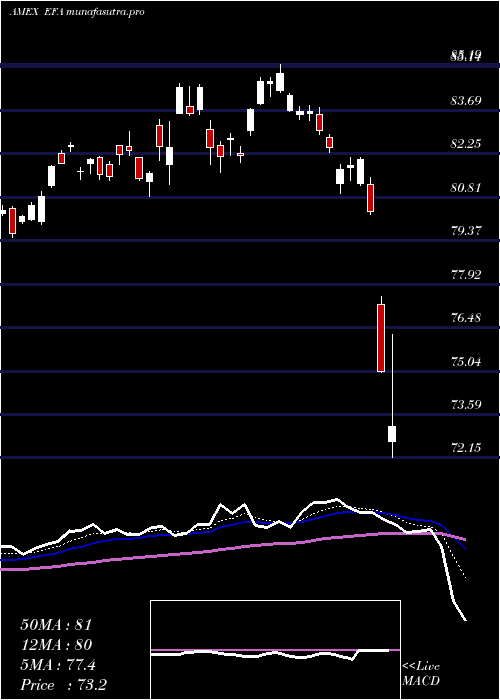
Daily price and volume Eafe Index
| Date |
Closing |
Open |
Range |
Volume |
Thu 23 October 2025 |
94.87 (0.44%) |
94.56 |
94.56 - 95.00 |
0.5297 times |
Wed 22 October 2025 |
94.45 (-0.15%) |
94.60 |
94.05 - 94.76 |
0.803 times |
Tue 21 October 2025 |
94.59 (-0.72%) |
94.86 |
94.55 - 95.00 |
1.1186 times |
Mon 20 October 2025 |
95.28 (0.81%) |
94.75 |
94.75 - 95.38 |
0.613 times |
Fri 17 October 2025 |
94.51 (0.18%) |
93.21 |
93.21 - 94.57 |
1.0183 times |
Thu 16 October 2025 |
94.34 (0.52%) |
94.05 |
93.99 - 94.74 |
1.3882 times |
Wed 15 October 2025 |
93.85 (0.48%) |
93.86 |
93.32 - 94.13 |
1.0084 times |
Tue 14 October 2025 |
93.40 (0.45%) |
92.45 |
92.34 - 93.68 |
1.0161 times |
Mon 13 October 2025 |
92.98 (0.8%) |
92.65 |
92.53 - 93.08 |
0.7482 times |
Fri 10 October 2025 |
92.24 (-1.84%) |
93.69 |
92.12 - 93.77 |
1.7565 times |
Thu 09 October 2025 |
93.97 (-0.82%) |
94.79 |
93.74 - 94.79 |
0.7102 times |
Weekly price and charts EafeIndex Strong weekly Stock price targets for EafeIndex EFA are 94.46 and 95.79 | Weekly Target 1 | 93.44 | | Weekly Target 2 | 94.15 | | Weekly Target 3 | 94.766666666667 | | Weekly Target 4 | 95.48 | | Weekly Target 5 | 96.1 |
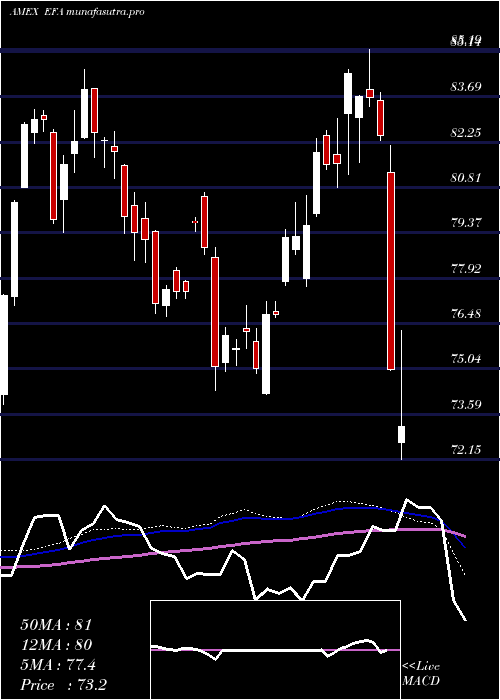
Weekly price and volumes for Eafe Index
| Date |
Closing |
Open |
Range |
Volume |
Thu 23 October 2025 |
94.87 (0.38%) |
94.75 |
94.05 - 95.38 |
0.7031 times |
Fri 17 October 2025 |
94.51 (2.46%) |
92.65 |
92.34 - 94.74 |
1.1884 times |
Fri 10 October 2025 |
92.24 (-2.99%) |
95.28 |
92.12 - 95.65 |
1.0443 times |
Fri 03 October 2025 |
95.08 (2.64%) |
92.92 |
92.77 - 95.27 |
1.2323 times |
Fri 26 September 2025 |
92.63 (-0.4%) |
92.96 |
91.53 - 93.67 |
1.2932 times |
Fri 19 September 2025 |
93.00 (0.01%) |
93.45 |
92.61 - 93.77 |
1.5116 times |
Fri 12 September 2025 |
92.99 (1.31%) |
92.46 |
92.15 - 93.39 |
0.8599 times |
Fri 05 September 2025 |
91.79 (0.34%) |
90.10 |
90.04 - 92.39 |
0.86 times |
Fri 29 August 2025 |
91.48 (0%) |
91.53 |
91.33 - 91.65 |
0.286 times |
Fri 29 August 2025 |
91.48 (-1.88%) |
92.79 |
91.04 - 92.95 |
1.0212 times |
Fri 22 August 2025 |
93.23 (1.13%) |
91.94 |
91.69 - 93.38 |
1.0063 times |
Monthly price and charts EafeIndex Strong monthly Stock price targets for EafeIndex EFA are 93.5 and 97.03 | Monthly Target 1 | 90.68 | | Monthly Target 2 | 92.78 | | Monthly Target 3 | 94.213333333333 | | Monthly Target 4 | 96.31 | | Monthly Target 5 | 97.74 |
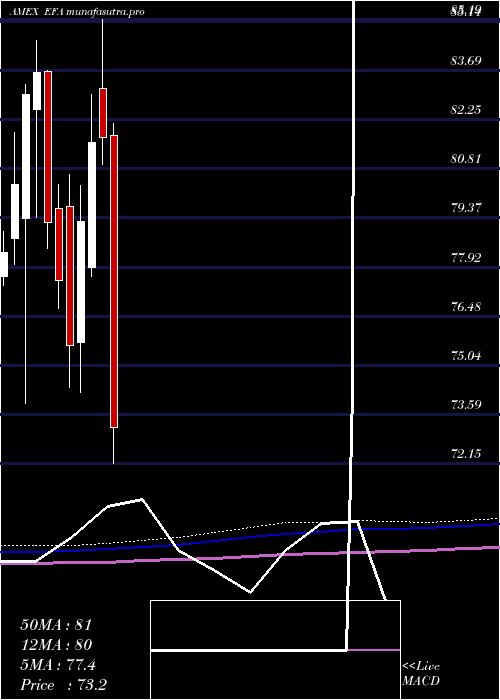
Monthly price and volumes Eafe Index
| Date |
Closing |
Open |
Range |
Volume |
Thu 23 October 2025 |
94.87 (1.61%) |
93.88 |
92.12 - 95.65 |
0.7949 times |
Tue 30 September 2025 |
93.37 (2.07%) |
90.10 |
90.04 - 93.77 |
1.1349 times |
Fri 29 August 2025 |
91.48 (4.52%) |
87.28 |
86.74 - 93.38 |
0.9163 times |
Thu 31 July 2025 |
87.52 (-2.09%) |
89.11 |
87.35 - 91.57 |
0.9038 times |
Mon 30 June 2025 |
89.39 (0.65%) |
88.97 |
85.68 - 90.51 |
1.0476 times |
Fri 30 May 2025 |
88.81 (4.79%) |
84.98 |
84.37 - 89.46 |
0.9036 times |
Wed 30 April 2025 |
84.75 (3.7%) |
81.78 |
72.15 - 85.03 |
1.609 times |
Mon 31 March 2025 |
81.73 (0.18%) |
83.17 |
80.92 - 85.19 |
1.056 times |
Fri 28 February 2025 |
81.58 (2.95%) |
77.91 |
77.65 - 82.99 |
0.7714 times |
Fri 31 January 2025 |
79.24 (4.8%) |
75.70 |
74.24 - 80.32 |
0.8625 times |
Tue 31 December 2024 |
75.61 (-2.45%) |
79.71 |
74.37 - 80.63 |
0.7522 times |
DMA SMA EMA moving averages of Eafe Index EFA
DMA (daily moving average) of Eafe Index EFA
| DMA period | DMA value | | 5 day DMA | 94.74 | | 12 day DMA | 94.1 | | 20 day DMA | 94.08 | | 35 day DMA | 93.55 | | 50 day DMA | 93.03 | | 100 day DMA | 91.1 | | 150 day DMA | 88.57 | | 200 day DMA | 86.52 | EMA (exponential moving average) of Eafe Index EFA
| EMA period | EMA current | EMA prev | EMA prev2 | | 5 day EMA | 94.62 | 94.49 | 94.51 | | 12 day EMA | 94.3 | 94.2 | 94.16 | | 20 day EMA | 94.02 | 93.93 | 93.88 | | 35 day EMA | 93.54 | 93.46 | 93.4 | | 50 day EMA | 93.03 | 92.95 | 92.89 |
SMA (simple moving average) of Eafe Index EFA
| SMA period | SMA current | SMA prev | SMA prev2 | | 5 day SMA | 94.74 | 94.63 | 94.51 | | 12 day SMA | 94.1 | 94.07 | 94.14 | | 20 day SMA | 94.08 | 93.93 | 93.83 | | 35 day SMA | 93.55 | 93.45 | 93.35 | | 50 day SMA | 93.03 | 92.97 | 92.91 | | 100 day SMA | 91.1 | 91.04 | 90.98 | | 150 day SMA | 88.57 | 88.5 | 88.44 | | 200 day SMA | 86.52 | 86.43 | 86.34 |
|
|
