UltrashortMsci EEV full analysis,charts,indicators,moving averages,SMA,DMA,EMA,ADX,MACD,RSIUltrashort Msci EEV WideScreen charts, DMA,SMA,EMA technical analysis, forecast prediction, by indicators ADX,MACD,RSI,CCI AMEX stock exchange
Daily price and charts and targets UltrashortMsci Strong Daily Stock price targets for UltrashortMsci EEV are 9.63 and 9.75 | Daily Target 1 | 9.6 | | Daily Target 2 | 9.65 | | Daily Target 3 | 9.7166666666667 | | Daily Target 4 | 9.77 | | Daily Target 5 | 9.84 |
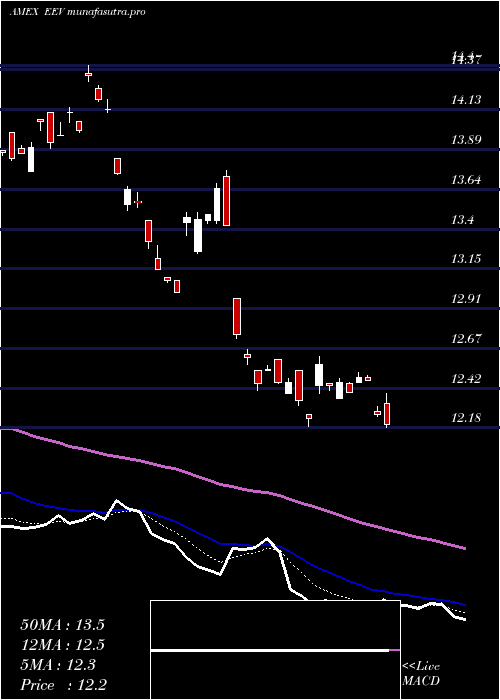
Daily price and volume Ultrashort Msci
| Date |
Closing |
Open |
Range |
Volume |
Thu 23 October 2025 |
9.71 (-1.62%) |
9.78 |
9.66 - 9.78 |
1.251 times |
Wed 22 October 2025 |
9.87 (0.1%) |
9.75 |
9.74 - 9.96 |
0.7607 times |
Tue 21 October 2025 |
9.86 (2.39%) |
9.73 |
9.73 - 9.86 |
2.0122 times |
Mon 20 October 2025 |
9.63 (-2.63%) |
9.75 |
9.61 - 9.75 |
1.8453 times |
Fri 17 October 2025 |
9.89 (0%) |
9.99 |
9.88 - 9.99 |
0.0731 times |
Thu 16 October 2025 |
9.89 (-1.3%) |
9.78 |
9.78 - 9.90 |
0.2965 times |
Wed 15 October 2025 |
10.02 (-3%) |
10.06 |
9.95 - 10.06 |
0.5637 times |
Tue 14 October 2025 |
10.33 (1.67%) |
10.44 |
10.29 - 10.44 |
0.164 times |
Mon 13 October 2025 |
10.16 (-5.75%) |
10.25 |
10.09 - 10.27 |
0.6901 times |
Fri 10 October 2025 |
10.78 (7.16%) |
10.03 |
10.01 - 10.81 |
2.3435 times |
Thu 09 October 2025 |
10.06 (2.13%) |
9.83 |
9.83 - 10.09 |
1.4792 times |
Weekly price and charts UltrashortMsci Strong weekly Stock price targets for UltrashortMsci EEV are 9.49 and 9.84 | Weekly Target 1 | 9.41 | | Weekly Target 2 | 9.56 | | Weekly Target 3 | 9.76 | | Weekly Target 4 | 9.91 | | Weekly Target 5 | 10.11 |
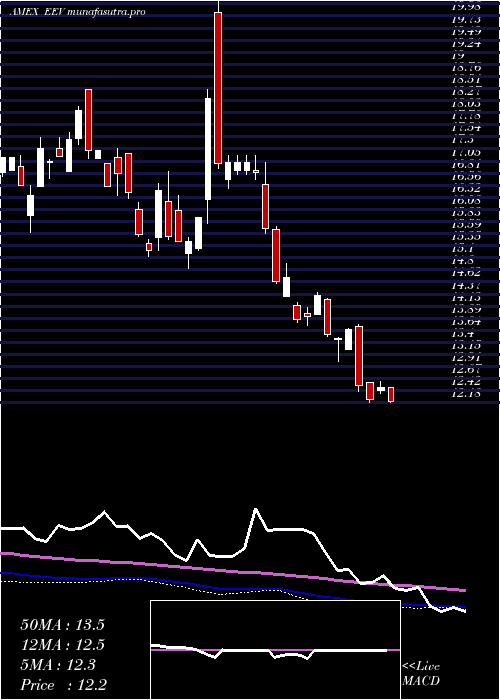
Weekly price and volumes for Ultrashort Msci
| Date |
Closing |
Open |
Range |
Volume |
Thu 23 October 2025 |
9.71 (-1.82%) |
9.75 |
9.61 - 9.96 |
2.4578 times |
Fri 17 October 2025 |
9.89 (-8.26%) |
10.25 |
9.78 - 10.44 |
0.7485 times |
Fri 10 October 2025 |
10.78 (8.45%) |
9.85 |
9.81 - 10.81 |
1.9438 times |
Fri 03 October 2025 |
9.94 (-5.51%) |
10.28 |
9.88 - 10.34 |
0.5594 times |
Fri 26 September 2025 |
10.52 (0.38%) |
10.49 |
10.29 - 10.62 |
1.5737 times |
Fri 19 September 2025 |
10.48 (-2.6%) |
10.67 |
10.36 - 10.67 |
0.5093 times |
Fri 12 September 2025 |
10.76 (-6.84%) |
11.44 |
10.74 - 11.45 |
1.2103 times |
Fri 05 September 2025 |
11.55 (-1.2%) |
12.04 |
11.47 - 12.04 |
0.2074 times |
Fri 29 August 2025 |
11.69 (0%) |
11.87 |
11.69 - 11.87 |
0.1259 times |
Fri 29 August 2025 |
11.69 (2.1%) |
11.45 |
11.45 - 11.92 |
0.6638 times |
Fri 22 August 2025 |
11.45 (-2.47%) |
11.64 |
11.43 - 11.94 |
1.4149 times |
Monthly price and charts UltrashortMsci Strong monthly Stock price targets for UltrashortMsci EEV are 9.06 and 10.26 | Monthly Target 1 | 8.84 | | Monthly Target 2 | 9.28 | | Monthly Target 3 | 10.043333333333 | | Monthly Target 4 | 10.48 | | Monthly Target 5 | 11.24 |
Monthly price and volumes Ultrashort Msci
| Date |
Closing |
Open |
Range |
Volume |
Thu 23 October 2025 |
9.71 (-5.08%) |
10.10 |
9.61 - 10.81 |
1.1976 times |
Tue 30 September 2025 |
10.23 (-12.49%) |
12.04 |
10.23 - 12.04 |
0.7829 times |
Fri 29 August 2025 |
11.69 (-5.65%) |
12.52 |
11.43 - 12.67 |
0.8023 times |
Thu 31 July 2025 |
12.39 (-0.56%) |
12.39 |
11.67 - 12.62 |
1.5993 times |
Mon 30 June 2025 |
12.46 (-13.11%) |
14.26 |
12.41 - 14.28 |
1.2631 times |
Fri 30 May 2025 |
14.34 (-7.12%) |
15.46 |
13.75 - 15.50 |
1.0112 times |
Wed 30 April 2025 |
15.44 (-3.2%) |
15.80 |
15.43 - 20.56 |
1.0626 times |
Mon 31 March 2025 |
15.95 (-3.04%) |
16.24 |
14.88 - 16.85 |
0.6024 times |
Fri 28 February 2025 |
16.45 (-2.08%) |
17.20 |
15.13 - 17.20 |
0.8281 times |
Fri 31 January 2025 |
16.80 (-3.06%) |
17.27 |
16.36 - 18.50 |
0.8503 times |
Tue 31 December 2024 |
17.33 (1.23%) |
16.95 |
15.62 - 17.53 |
0.4884 times |
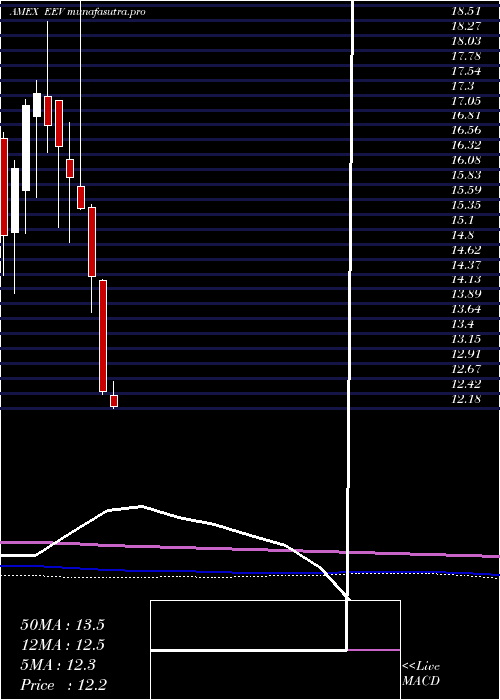
DMA SMA EMA moving averages of Ultrashort Msci EEV
DMA (daily moving average) of Ultrashort Msci EEV
| DMA period | DMA value | | 5 day DMA | 9.79 | | 12 day DMA | 10 | | 20 day DMA | 10.05 | | 35 day DMA | 10.33 | | 50 day DMA | 10.75 | | 100 day DMA | 11.66 | | 150 day DMA | 12.98 | | 200 day DMA | 13.82 | EMA (exponential moving average) of Ultrashort Msci EEV
| EMA period | EMA current | EMA prev | EMA prev2 | | 5 day EMA | 9.82 | 9.88 | 9.88 | | 12 day EMA | 9.95 | 9.99 | 10.01 | | 20 day EMA | 10.09 | 10.13 | 10.16 | | 35 day EMA | 10.43 | 10.47 | 10.51 | | 50 day EMA | 10.74 | 10.78 | 10.82 |
SMA (simple moving average) of Ultrashort Msci EEV
| SMA period | SMA current | SMA prev | SMA prev2 | | 5 day SMA | 9.79 | 9.83 | 9.86 | | 12 day SMA | 10 | 10.03 | 10.03 | | 20 day SMA | 10.05 | 10.08 | 10.11 | | 35 day SMA | 10.33 | 10.39 | 10.45 | | 50 day SMA | 10.75 | 10.79 | 10.82 | | 100 day SMA | 11.66 | 11.71 | 11.75 | | 150 day SMA | 12.98 | 13.01 | 13.05 | | 200 day SMA | 13.82 | 13.86 | 13.89 |
|
|
