EmrgMkts EDC full analysis,charts,indicators,moving averages,SMA,DMA,EMA,ADX,MACD,RSIEmrg Mkts EDC WideScreen charts, DMA,SMA,EMA technical analysis, forecast prediction, by indicators ADX,MACD,RSI,CCI AMEX stock exchange
Daily price and charts and targets EmrgMkts Strong Daily Stock price targets for EmrgMkts EDC are 54.74 and 55.74 | Daily Target 1 | 53.97 | | Daily Target 2 | 54.51 | | Daily Target 3 | 54.973333333333 | | Daily Target 4 | 55.51 | | Daily Target 5 | 55.97 |
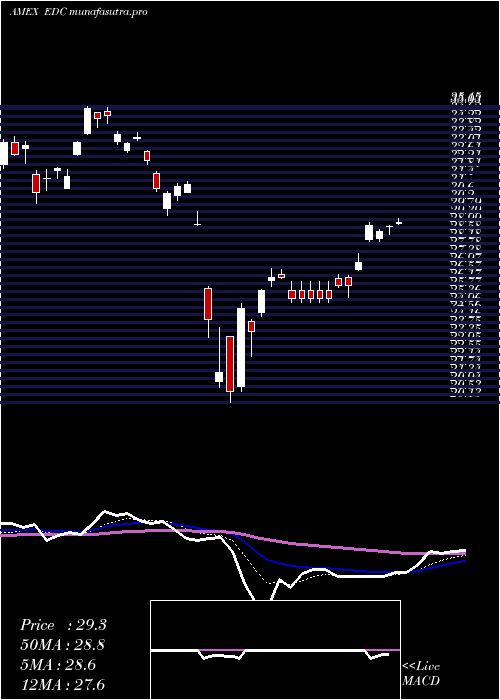
Daily price and volume Emrg Mkts
| Date |
Closing |
Open |
Range |
Volume |
Fri 24 October 2025 |
55.04 (1.83%) |
54.44 |
54.44 - 55.44 |
1.5337 times |
Thu 23 October 2025 |
54.05 (2.76%) |
53.11 |
53.11 - 54.25 |
0.5943 times |
Wed 22 October 2025 |
52.60 (-0.25%) |
52.66 |
51.50 - 53.75 |
0.6056 times |
Tue 21 October 2025 |
52.73 (-3.65%) |
53.42 |
52.67 - 53.46 |
0.71 times |
Mon 20 October 2025 |
54.73 (4.35%) |
53.85 |
53.28 - 54.92 |
1.5629 times |
Fri 17 October 2025 |
52.45 (-0.34%) |
49.90 |
49.90 - 52.74 |
0.5379 times |
Thu 16 October 2025 |
52.63 (2.04%) |
53.00 |
52.01 - 53.63 |
1.2132 times |
Wed 15 October 2025 |
51.58 (5.09%) |
51.50 |
50.65 - 52.02 |
0.9762 times |
Tue 14 October 2025 |
49.08 (-3.18%) |
48.11 |
47.97 - 50.31 |
0.863 times |
Mon 13 October 2025 |
50.69 (8.66%) |
50.46 |
49.94 - 51.08 |
1.4032 times |
Fri 10 October 2025 |
46.65 (-10.82%) |
52.49 |
46.11 - 52.55 |
5.5254 times |
Weekly price and charts EmrgMkts Strong weekly Stock price targets for EmrgMkts EDC are 53.27 and 57.21 | Weekly Target 1 | 50.05 | | Weekly Target 2 | 52.55 | | Weekly Target 3 | 53.993333333333 | | Weekly Target 4 | 56.49 | | Weekly Target 5 | 57.93 |
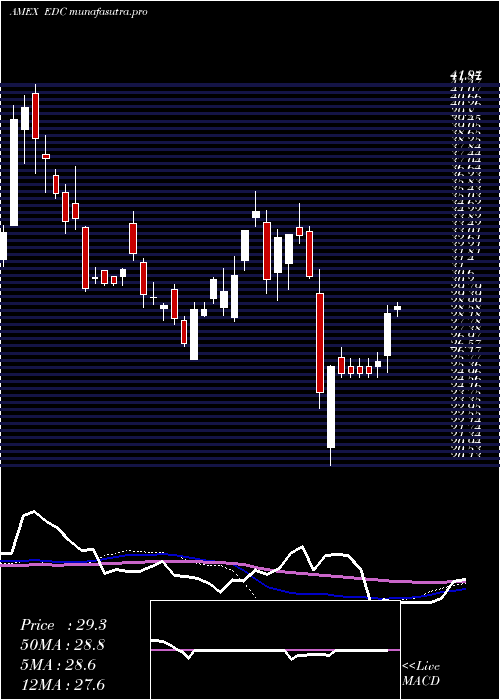
Weekly price and volumes for Emrg Mkts
| Date |
Closing |
Open |
Range |
Volume |
Fri 24 October 2025 |
55.04 (4.94%) |
53.85 |
51.50 - 55.44 |
1.0202 times |
Fri 17 October 2025 |
52.45 (12.43%) |
50.46 |
47.97 - 53.63 |
1.0175 times |
Fri 10 October 2025 |
46.65 (-12.53%) |
53.58 |
46.11 - 54.70 |
1.728 times |
Fri 03 October 2025 |
53.33 (8.64%) |
50.51 |
50.28 - 54.00 |
0.8669 times |
Fri 26 September 2025 |
49.09 (-2.25%) |
50.39 |
48.08 - 51.56 |
0.7468 times |
Fri 19 September 2025 |
50.22 (3.93%) |
49.11 |
48.86 - 53.20 |
1.338 times |
Fri 12 September 2025 |
48.32 (10.83%) |
44.21 |
44.07 - 48.53 |
1.072 times |
Fri 05 September 2025 |
43.60 (3.29%) |
41.02 |
40.86 - 43.97 |
0.763 times |
Fri 29 August 2025 |
42.21 (0%) |
42.08 |
41.66 - 42.28 |
0.231 times |
Fri 29 August 2025 |
42.21 (-4.52%) |
44.05 |
41.56 - 44.28 |
1.2167 times |
Fri 22 August 2025 |
44.21 (3.71%) |
43.21 |
41.36 - 44.27 |
1.5179 times |
Monthly price and charts EmrgMkts Strong monthly Stock price targets for EmrgMkts EDC are 50.58 and 59.91 | Monthly Target 1 | 42.87 | | Monthly Target 2 | 48.95 | | Monthly Target 3 | 52.196666666667 | | Monthly Target 4 | 58.28 | | Monthly Target 5 | 61.53 |
Monthly price and volumes Emrg Mkts
| Date |
Closing |
Open |
Range |
Volume |
Fri 24 October 2025 |
55.04 (7.92%) |
51.61 |
46.11 - 55.44 |
0.7067 times |
Tue 30 September 2025 |
51.00 (20.82%) |
41.02 |
40.86 - 53.20 |
0.7027 times |
Fri 29 August 2025 |
42.21 (6.83%) |
39.06 |
38.08 - 44.38 |
0.9672 times |
Thu 31 July 2025 |
39.51 (0.95%) |
39.40 |
38.42 - 43.12 |
0.9298 times |
Mon 30 June 2025 |
39.14 (19.69%) |
33.06 |
32.70 - 39.50 |
0.9789 times |
Fri 30 May 2025 |
32.70 (10.96%) |
29.82 |
29.38 - 35.20 |
0.7968 times |
Wed 30 April 2025 |
29.47 (-4.07%) |
30.62 |
20.13 - 31.33 |
1.1921 times |
Mon 31 March 2025 |
30.72 (-0.23%) |
31.17 |
29.55 - 35.15 |
1.1918 times |
Fri 28 February 2025 |
30.79 (2.22%) |
28.62 |
28.35 - 35.81 |
1.3274 times |
Fri 31 January 2025 |
30.12 (4.69%) |
28.74 |
26.18 - 31.42 |
1.2067 times |
Tue 31 December 2024 |
28.77 (-5.76%) |
30.95 |
28.62 - 34.70 |
0.8183 times |

DMA SMA EMA moving averages of Emrg Mkts EDC
DMA (daily moving average) of Emrg Mkts EDC
| DMA period | DMA value | | 5 day DMA | 53.83 | | 12 day DMA | 52.05 | | 20 day DMA | 52.28 | | 35 day DMA | 50.89 | | 50 day DMA | 48.43 | | 100 day DMA | 43.89 | | 150 day DMA | 39.24 | | 200 day DMA | 37.29 | EMA (exponential moving average) of Emrg Mkts EDC
| EMA period | EMA current | EMA prev | EMA prev2 | | 5 day EMA | 53.77 | 53.14 | 52.68 | | 12 day EMA | 52.82 | 52.42 | 52.12 | | 20 day EMA | 52.04 | 51.72 | 51.47 | | 35 day EMA | 50.23 | 49.95 | 49.71 | | 50 day EMA | 48.5 | 48.23 | 47.99 |
SMA (simple moving average) of Emrg Mkts EDC
| SMA period | SMA current | SMA prev | SMA prev2 | | 5 day SMA | 53.83 | 53.31 | 53.03 | | 12 day SMA | 52.05 | 51.96 | 51.86 | | 20 day SMA | 52.28 | 51.98 | 51.75 | | 35 day SMA | 50.89 | 50.56 | 50.22 | | 50 day SMA | 48.43 | 48.18 | 47.95 | | 100 day SMA | 43.89 | 43.68 | 43.46 | | 150 day SMA | 39.24 | 39.09 | 38.96 | | 200 day SMA | 37.29 | 37.16 | 37.03 |
|
|
