JapanHedged DXJ full analysis,charts,indicators,moving averages,SMA,DMA,EMA,ADX,MACD,RSIJapan Hedged DXJ WideScreen charts, DMA,SMA,EMA technical analysis, forecast prediction, by indicators ADX,MACD,RSI,CCI AMEX stock exchange
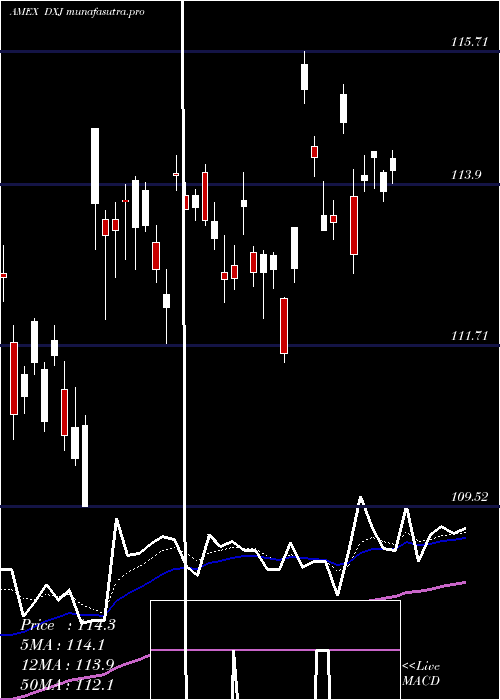
Daily price and charts and targets JapanHedged Strong Daily Stock price targets for JapanHedged DXJ are 133.44 and 134.39 | Daily Target 1 | 132.71 | | Daily Target 2 | 133.22 | | Daily Target 3 | 133.65666666667 | | Daily Target 4 | 134.17 | | Daily Target 5 | 134.61 |
Daily price and volume Japan Hedged
| Date |
Closing |
Open |
Range |
Volume |
Thu 23 October 2025 |
133.74 (0.44%) |
133.14 |
133.14 - 134.09 |
0.9618 times |
Wed 22 October 2025 |
133.15 (0.2%) |
133.38 |
132.00 - 133.46 |
0.7534 times |
Tue 21 October 2025 |
132.88 (-0.27%) |
133.02 |
132.51 - 133.39 |
1.4871 times |
Mon 20 October 2025 |
133.24 (1.6%) |
133.02 |
132.79 - 133.40 |
0.3401 times |
Fri 17 October 2025 |
131.14 (0.68%) |
130.70 |
130.45 - 132.00 |
0.2707 times |
Thu 16 October 2025 |
130.26 (-0.58%) |
131.26 |
129.84 - 131.31 |
0.5221 times |
Wed 15 October 2025 |
131.02 (0.99%) |
131.26 |
130.44 - 131.67 |
1.0524 times |
Tue 14 October 2025 |
129.74 (0.6%) |
128.66 |
128.49 - 130.32 |
0.8111 times |
Mon 13 October 2025 |
128.97 (1.4%) |
128.43 |
128.06 - 129.09 |
1.331 times |
Fri 10 October 2025 |
127.19 (-4.33%) |
129.92 |
126.81 - 130.21 |
2.4703 times |
Thu 09 October 2025 |
132.95 (-0.28%) |
133.40 |
132.77 - 133.63 |
2.9539 times |
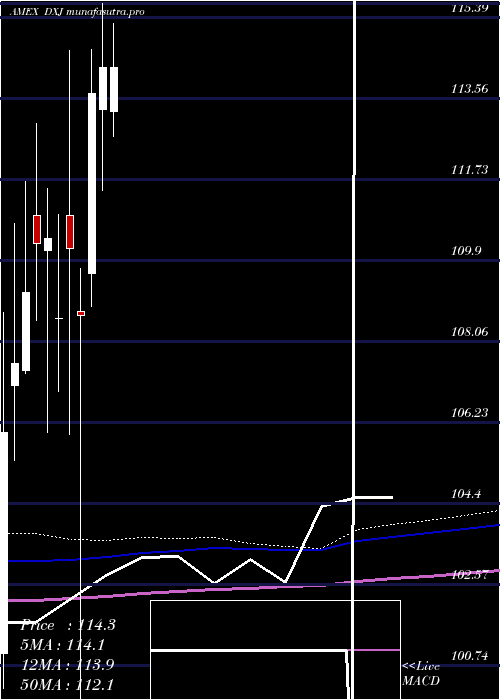
Weekly price and charts JapanHedged Strong weekly Stock price targets for JapanHedged DXJ are 132.87 and 134.96 | Weekly Target 1 | 131.19 | | Weekly Target 2 | 132.46 | | Weekly Target 3 | 133.27666666667 | | Weekly Target 4 | 134.55 | | Weekly Target 5 | 135.37 |
Weekly price and volumes for Japan Hedged
| Date |
Closing |
Open |
Range |
Volume |
Thu 23 October 2025 |
133.74 (1.98%) |
133.02 |
132.00 - 134.09 |
1.0541 times |
Fri 17 October 2025 |
131.14 (3.11%) |
128.43 |
128.06 - 132.00 |
1.1864 times |
Fri 10 October 2025 |
127.19 (-1.87%) |
132.28 |
126.81 - 133.63 |
2.7681 times |
Fri 03 October 2025 |
129.61 (-0.16%) |
129.05 |
126.76 - 129.90 |
1.1407 times |
Fri 26 September 2025 |
129.82 (0.6%) |
129.37 |
129.05 - 130.32 |
0.6321 times |
Fri 19 September 2025 |
129.05 (0.3%) |
128.66 |
128.16 - 130.17 |
0.7116 times |
Fri 12 September 2025 |
128.66 (1.14%) |
129.31 |
127.44 - 129.97 |
1.0106 times |
Fri 05 September 2025 |
127.21 (2.23%) |
125.03 |
124.53 - 128.13 |
0.6836 times |
Fri 29 August 2025 |
124.43 (0%) |
124.88 |
124.14 - 124.88 |
0.1523 times |
Fri 29 August 2025 |
124.43 (-1.57%) |
126.13 |
124.14 - 126.33 |
0.6605 times |
Fri 22 August 2025 |
126.41 (0.44%) |
126.35 |
125.16 - 126.88 |
0.6161 times |
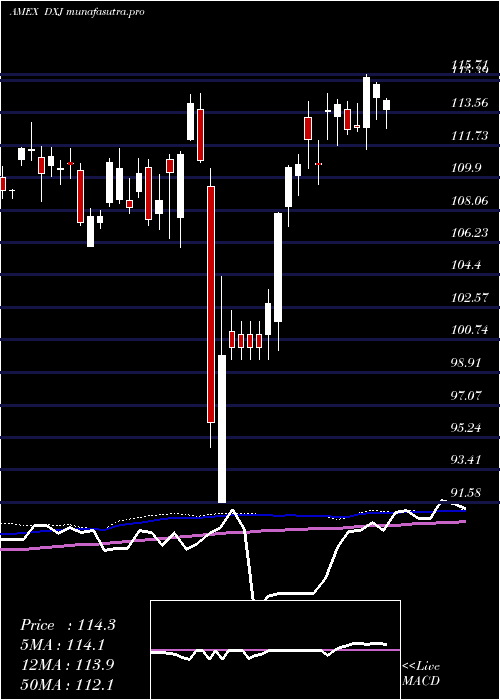
Monthly price and charts JapanHedged Strong monthly Stock price targets for JapanHedged DXJ are 130.25 and 137.58 | Monthly Target 1 | 124.2 | | Monthly Target 2 | 128.97 | | Monthly Target 3 | 131.53 | | Monthly Target 4 | 136.3 | | Monthly Target 5 | 138.86 |
Monthly price and volumes Japan Hedged
| Date |
Closing |
Open |
Range |
Volume |
Thu 23 October 2025 |
133.74 (4.46%) |
127.27 |
126.76 - 134.09 |
1.1794 times |
Tue 30 September 2025 |
128.03 (2.89%) |
125.03 |
124.53 - 130.32 |
0.6703 times |
Fri 29 August 2025 |
124.43 (4.25%) |
118.14 |
116.71 - 126.88 |
0.7804 times |
Thu 31 July 2025 |
119.36 (4.45%) |
113.27 |
112.69 - 121.11 |
0.9318 times |
Mon 30 June 2025 |
114.27 (0.52%) |
113.31 |
111.49 - 115.71 |
0.6783 times |
Fri 30 May 2025 |
113.68 (4.63%) |
109.60 |
108.86 - 114.66 |
0.8881 times |
Wed 30 April 2025 |
108.65 (-1.39%) |
108.75 |
91.58 - 109.70 |
1.7534 times |
Mon 31 March 2025 |
110.18 (1.47%) |
110.92 |
105.96 - 114.64 |
1.0878 times |
Fri 28 February 2025 |
108.58 (-1.64%) |
108.58 |
106.94 - 110.94 |
0.9433 times |
Fri 31 January 2025 |
110.39 (0.09%) |
110.12 |
106.02 - 111.52 |
1.0872 times |
Tue 31 December 2024 |
110.29 (1.02%) |
110.92 |
108.55 - 113.00 |
0.7796 times |
DMA SMA EMA moving averages of Japan Hedged DXJ
DMA (daily moving average) of Japan Hedged DXJ
| DMA period | DMA value | | 5 day DMA | 132.83 | | 12 day DMA | 131.47 | | 20 day DMA | 130.71 | | 35 day DMA | 130.02 | | 50 day DMA | 128.72 | | 100 day DMA | 122.41 | | 150 day DMA | 117.39 | | 200 day DMA | 115.4 | EMA (exponential moving average) of Japan Hedged DXJ
| EMA period | EMA current | EMA prev | EMA prev2 | | 5 day EMA | 132.81 | 132.34 | 131.93 | | 12 day EMA | 131.77 | 131.41 | 131.09 | | 20 day EMA | 131.03 | 130.75 | 130.5 | | 35 day EMA | 129.81 | 129.58 | 129.37 | | 50 day EMA | 128.78 | 128.58 | 128.39 |
SMA (simple moving average) of Japan Hedged DXJ
| SMA period | SMA current | SMA prev | SMA prev2 | | 5 day SMA | 132.83 | 132.13 | 131.71 | | 12 day SMA | 131.47 | 131.39 | 131.39 | | 20 day SMA | 130.71 | 130.51 | 130.34 | | 35 day SMA | 130.02 | 129.83 | 129.61 | | 50 day SMA | 128.72 | 128.54 | 128.37 | | 100 day SMA | 122.41 | 122.2 | 122.01 | | 150 day SMA | 117.39 | 117.26 | 117.13 | | 200 day SMA | 115.4 | 115.29 | 115.18 |
|
|
