IndustrialsBull DUSL full analysis,charts,indicators,moving averages,SMA,DMA,EMA,ADX,MACD,RSIIndustrials Bull DUSL WideScreen charts, DMA,SMA,EMA technical analysis, forecast prediction, by indicators ADX,MACD,RSI,CCI AMEX stock exchange
Daily price and charts and targets IndustrialsBull Strong Daily Stock price targets for IndustrialsBull DUSL are 74.95 and 76.57 | Daily Target 1 | 74.67 | | Daily Target 2 | 75.22 | | Daily Target 3 | 76.293333333333 | | Daily Target 4 | 76.84 | | Daily Target 5 | 77.91 |
Daily price and volume Industrials Bull
| Date |
Closing |
Open |
Range |
Volume |
Fri 24 October 2025 |
75.76 (0.5%) |
77.37 |
75.75 - 77.37 |
0.8146 times |
Thu 23 October 2025 |
75.38 (3.59%) |
75.00 |
74.36 - 75.52 |
0.7641 times |
Wed 22 October 2025 |
72.77 (-4.25%) |
76.35 |
72.51 - 76.74 |
1.4513 times |
Tue 21 October 2025 |
76.00 (2.47%) |
74.36 |
74.36 - 76.28 |
0.9031 times |
Mon 20 October 2025 |
74.17 (3.82%) |
72.27 |
72.27 - 74.27 |
0.4124 times |
Fri 17 October 2025 |
71.44 (0.22%) |
69.40 |
69.40 - 72.11 |
0.6879 times |
Thu 16 October 2025 |
71.28 (-2.07%) |
74.08 |
70.20 - 74.08 |
0.2938 times |
Wed 15 October 2025 |
72.79 (-1.23%) |
74.85 |
71.95 - 75.50 |
1.1341 times |
Tue 14 October 2025 |
73.70 (3.55%) |
69.53 |
69.23 - 74.56 |
1.6381 times |
Mon 13 October 2025 |
71.17 (3.04%) |
70.72 |
70.25 - 71.94 |
1.9006 times |
Fri 10 October 2025 |
69.07 (-6.71%) |
74.38 |
69.07 - 74.38 |
2.1211 times |
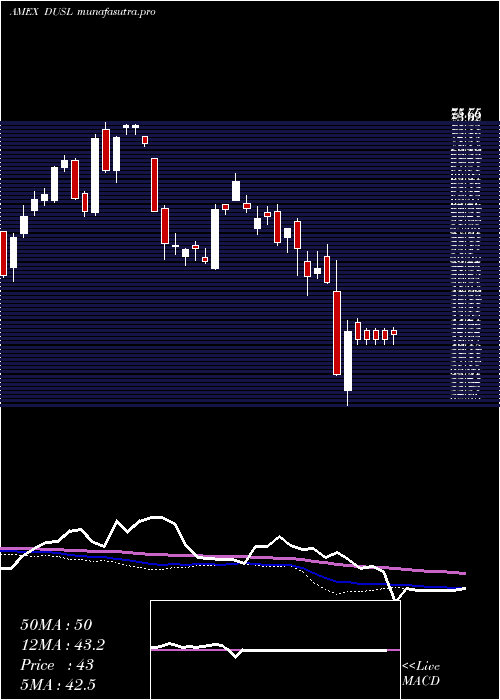
Weekly price and charts IndustrialsBull Strong weekly Stock price targets for IndustrialsBull DUSL are 74.02 and 79.12 | Weekly Target 1 | 70.03 | | Weekly Target 2 | 72.9 | | Weekly Target 3 | 75.133333333333 | | Weekly Target 4 | 78 | | Weekly Target 5 | 80.23 |
Weekly price and volumes for Industrials Bull
| Date |
Closing |
Open |
Range |
Volume |
Fri 24 October 2025 |
75.76 (6.05%) |
72.27 |
72.27 - 77.37 |
0.8417 times |
Fri 17 October 2025 |
71.44 (3.43%) |
70.72 |
69.23 - 75.50 |
1.0952 times |
Fri 10 October 2025 |
69.07 (-8.94%) |
76.70 |
69.07 - 77.93 |
1.4111 times |
Fri 03 October 2025 |
75.85 (3.3%) |
75.32 |
73.38 - 77.16 |
0.6195 times |
Fri 26 September 2025 |
73.43 (0.26%) |
72.86 |
70.78 - 75.79 |
1.0535 times |
Fri 19 September 2025 |
73.24 (2.19%) |
71.89 |
69.71 - 73.77 |
1.3302 times |
Fri 12 September 2025 |
71.67 (1.29%) |
71.29 |
68.55 - 73.77 |
1.198 times |
Fri 05 September 2025 |
70.76 (-2.39%) |
70.37 |
68.41 - 72.04 |
1.0088 times |
Fri 29 August 2025 |
72.49 (0%) |
74.37 |
71.79 - 74.37 |
0.2563 times |
Fri 29 August 2025 |
72.49 (-2.44%) |
74.29 |
71.79 - 75.04 |
1.1857 times |
Fri 22 August 2025 |
74.30 (5.17%) |
70.49 |
70.49 - 75.92 |
0.7363 times |
Monthly price and charts IndustrialsBull Strong monthly Stock price targets for IndustrialsBull DUSL are 72.42 and 81.28 | Monthly Target 1 | 65.39 | | Monthly Target 2 | 70.58 | | Monthly Target 3 | 74.253333333333 | | Monthly Target 4 | 79.44 | | Monthly Target 5 | 83.11 |
Monthly price and volumes Industrials Bull
| Date |
Closing |
Open |
Range |
Volume |
Fri 24 October 2025 |
75.76 (0.05%) |
74.68 |
69.07 - 77.93 |
0.5525 times |
Tue 30 September 2025 |
75.72 (4.46%) |
70.37 |
68.41 - 75.79 |
0.7342 times |
Fri 29 August 2025 |
72.49 (-1.28%) |
70.69 |
68.29 - 75.92 |
0.7088 times |
Thu 31 July 2025 |
73.43 (7.87%) |
67.50 |
67.38 - 78.10 |
1.0307 times |
Mon 30 June 2025 |
68.07 (9.93%) |
61.47 |
59.49 - 68.07 |
0.7039 times |
Fri 30 May 2025 |
61.92 (26.63%) |
49.61 |
49.50 - 64.45 |
1.0727 times |
Wed 30 April 2025 |
48.90 (-6.14%) |
50.71 |
32.06 - 54.39 |
1.0774 times |
Mon 31 March 2025 |
52.10 (-12.13%) |
60.42 |
48.93 - 60.84 |
0.8127 times |
Fri 28 February 2025 |
59.29 (-5.06%) |
59.32 |
55.65 - 63.10 |
0.9645 times |
Fri 31 January 2025 |
62.45 (13.59%) |
55.92 |
53.00 - 67.85 |
2.3426 times |
Tue 31 December 2024 |
54.98 (-27%) |
73.65 |
53.60 - 73.65 |
1.1648 times |

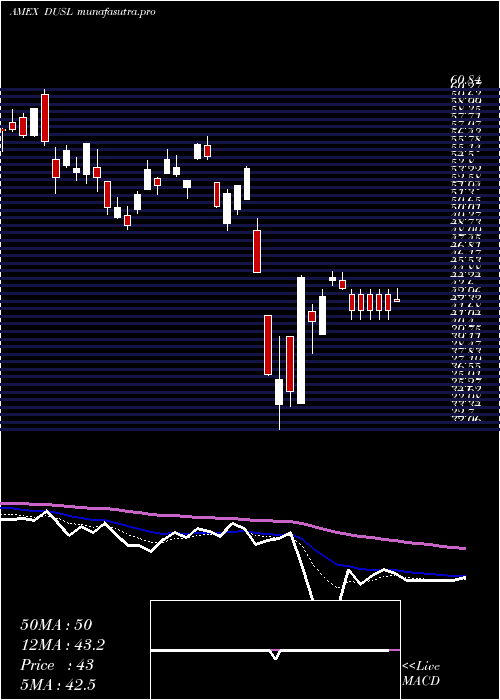
DMA SMA EMA moving averages of Industrials Bull DUSL
DMA (daily moving average) of Industrials Bull DUSL
| DMA period | DMA value | | 5 day DMA | 74.82 | | 12 day DMA | 73.13 | | 20 day DMA | 74.19 | | 35 day DMA | 73.39 | | 50 day DMA | 73.04 | | 100 day DMA | 71.1 | | 150 day DMA | 64.44 | | 200 day DMA | 63.04 | EMA (exponential moving average) of Industrials Bull DUSL
| EMA period | EMA current | EMA prev | EMA prev2 | | 5 day EMA | 74.67 | 74.12 | 73.49 | | 12 day EMA | 74.04 | 73.73 | 73.43 | | 20 day EMA | 73.82 | 73.62 | 73.43 | | 35 day EMA | 73.48 | 73.35 | 73.23 | | 50 day EMA | 73.14 | 73.03 | 72.93 |
SMA (simple moving average) of Industrials Bull DUSL
| SMA period | SMA current | SMA prev | SMA prev2 | | 5 day SMA | 74.82 | 73.95 | 73.13 | | 12 day SMA | 73.13 | 73.28 | 73.3 | | 20 day SMA | 74.19 | 74.07 | 73.88 | | 35 day SMA | 73.39 | 73.25 | 73.14 | | 50 day SMA | 73.04 | 72.94 | 72.87 | | 100 day SMA | 71.1 | 70.95 | 70.82 | | 150 day SMA | 64.44 | 64.29 | 64.14 | | 200 day SMA | 63.04 | 62.94 | 62.84 |
|
|
