VaneckVectors DURA full analysis,charts,indicators,moving averages,SMA,DMA,EMA,ADX,MACD,RSIVaneck Vectors DURA WideScreen charts, DMA,SMA,EMA technical analysis, forecast prediction, by indicators ADX,MACD,RSI,CCI AMEX stock exchange
Daily price and charts and targets VaneckVectors Strong Daily Stock price targets for VaneckVectors DURA are 33.58 and 33.64 | Daily Target 1 | 33.57 | | Daily Target 2 | 33.59 | | Daily Target 3 | 33.63 | | Daily Target 4 | 33.65 | | Daily Target 5 | 33.69 |
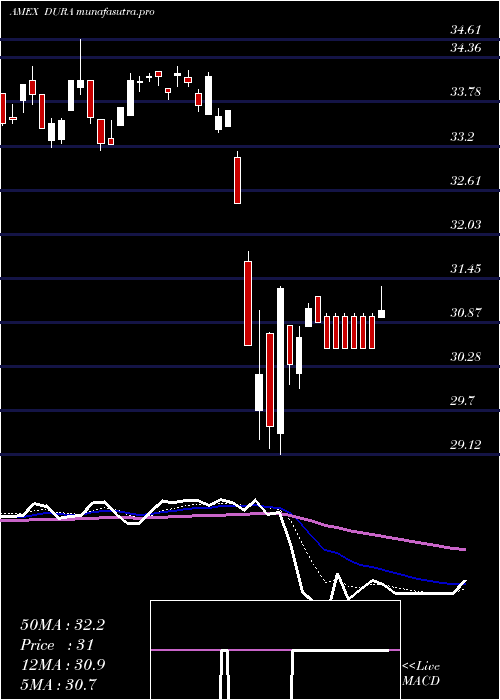
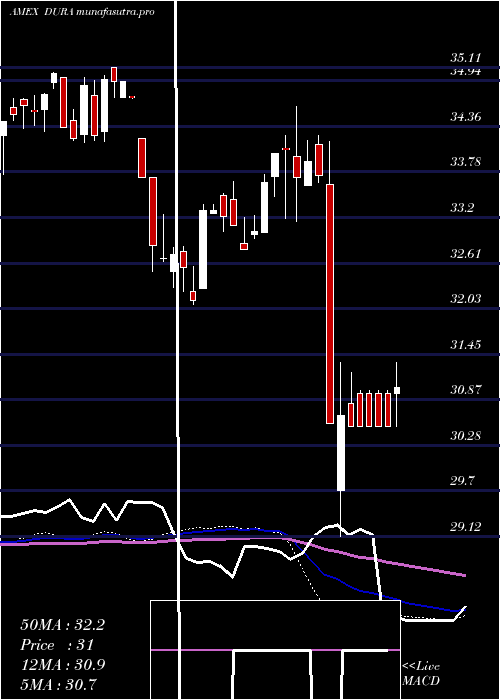
Daily price and volume Vaneck Vectors
| Date |
Closing |
Open |
Range |
Volume |
Thu 23 October 2025 |
33.61 (-0.39%) |
33.66 |
33.61 - 33.67 |
2.0997 times |
Wed 22 October 2025 |
33.74 (0.06%) |
33.73 |
33.71 - 33.80 |
1.5291 times |
Tue 21 October 2025 |
33.72 (-0.09%) |
33.68 |
33.67 - 33.72 |
0.185 times |
Mon 20 October 2025 |
33.75 (0.54%) |
33.71 |
33.63 - 33.75 |
2.3563 times |
Fri 17 October 2025 |
33.57 (0.87%) |
33.41 |
33.38 - 33.57 |
0.5903 times |
Thu 16 October 2025 |
33.28 (-0.63%) |
33.30 |
33.26 - 33.30 |
0.6489 times |
Wed 15 October 2025 |
33.49 (-0.3%) |
33.42 |
33.42 - 33.49 |
0.3701 times |
Tue 14 October 2025 |
33.59 (0.75%) |
33.46 |
33.46 - 33.59 |
0.4318 times |
Mon 13 October 2025 |
33.34 (0.33%) |
33.26 |
33.26 - 33.34 |
0.8019 times |
Fri 10 October 2025 |
33.23 (-0.75%) |
33.44 |
33.23 - 33.61 |
0.9869 times |
Thu 09 October 2025 |
33.48 (-0.36%) |
33.56 |
33.44 - 33.56 |
2.529 times |
Weekly price and charts VaneckVectors Strong weekly Stock price targets for VaneckVectors DURA are 33.52 and 33.71 | Weekly Target 1 | 33.48 | | Weekly Target 2 | 33.55 | | Weekly Target 3 | 33.673333333333 | | Weekly Target 4 | 33.74 | | Weekly Target 5 | 33.86 |
Weekly price and volumes for Vaneck Vectors
| Date |
Closing |
Open |
Range |
Volume |
Thu 23 October 2025 |
33.61 (0.12%) |
33.71 |
33.61 - 33.80 |
0.7389 times |
Fri 17 October 2025 |
33.57 (1.02%) |
33.26 |
33.26 - 33.59 |
0.3404 times |
Fri 10 October 2025 |
33.23 (-1.63%) |
33.89 |
33.23 - 33.89 |
2.588 times |
Fri 03 October 2025 |
33.78 (-0.15%) |
33.69 |
33.61 - 33.92 |
1.5095 times |
Fri 26 September 2025 |
33.83 (0.65%) |
33.37 |
32.71 - 33.87 |
0.9307 times |
Fri 19 September 2025 |
33.61 (-0.68%) |
33.69 |
33.60 - 34.00 |
1.0193 times |
Fri 12 September 2025 |
33.84 (-0.12%) |
33.92 |
33.53 - 34.09 |
1.0119 times |
Fri 05 September 2025 |
33.88 (-1.25%) |
34.24 |
33.76 - 34.24 |
0.9011 times |
Fri 29 August 2025 |
34.31 (0%) |
34.24 |
34.24 - 34.31 |
0.1847 times |
Fri 29 August 2025 |
34.31 (-0.55%) |
34.26 |
34.09 - 34.32 |
0.7756 times |
Fri 22 August 2025 |
34.50 (2.4%) |
33.65 |
33.57 - 34.51 |
0.4653 times |
Monthly price and charts VaneckVectors Strong monthly Stock price targets for VaneckVectors DURA are 33.09 and 33.75 | Monthly Target 1 | 32.92 | | Monthly Target 2 | 33.26 | | Monthly Target 3 | 33.576666666667 | | Monthly Target 4 | 33.92 | | Monthly Target 5 | 34.24 |
Monthly price and volumes Vaneck Vectors
| Date |
Closing |
Open |
Range |
Volume |
Thu 23 October 2025 |
33.61 (-0.91%) |
33.71 |
33.23 - 33.89 |
0.4918 times |
Tue 30 September 2025 |
33.92 (-1.14%) |
34.24 |
32.71 - 34.24 |
0.4903 times |
Fri 29 August 2025 |
34.31 (4.54%) |
32.73 |
32.54 - 34.51 |
0.3298 times |
Thu 31 July 2025 |
32.82 (0.55%) |
32.40 |
32.40 - 33.79 |
0.9639 times |
Mon 30 June 2025 |
32.64 (1.94%) |
31.93 |
31.89 - 32.75 |
0.6228 times |
Fri 30 May 2025 |
32.02 (1.33%) |
31.43 |
31.29 - 32.51 |
0.9807 times |
Wed 30 April 2025 |
31.60 (-7.36%) |
33.41 |
29.12 - 33.69 |
1.8704 times |
Mon 31 March 2025 |
34.11 (0.29%) |
34.07 |
33.14 - 34.61 |
2.2061 times |
Fri 28 February 2025 |
34.01 (2.78%) |
32.87 |
32.79 - 34.01 |
1.0625 times |
Fri 31 January 2025 |
33.09 (1.63%) |
32.80 |
32.08 - 33.66 |
0.9816 times |
Tue 31 December 2024 |
32.56 (-6.78%) |
34.74 |
32.30 - 34.74 |
1.038 times |

DMA SMA EMA moving averages of Vaneck Vectors DURA
DMA (daily moving average) of Vaneck Vectors DURA
| DMA period | DMA value | | 5 day DMA | 33.68 | | 12 day DMA | 33.53 | | 20 day DMA | 33.62 | | 35 day DMA | 33.67 | | 50 day DMA | 33.79 | | 100 day DMA | 33.37 | | 150 day DMA | 32.8 | | 200 day DMA | 32.94 | EMA (exponential moving average) of Vaneck Vectors DURA
| EMA period | EMA current | EMA prev | EMA prev2 | | 5 day EMA | 33.64 | 33.65 | 33.61 | | 12 day EMA | 33.6 | 33.6 | 33.58 | | 20 day EMA | 33.63 | 33.63 | 33.62 | | 35 day EMA | 33.67 | 33.67 | 33.67 | | 50 day EMA | 33.74 | 33.75 | 33.75 |
SMA (simple moving average) of Vaneck Vectors DURA
| SMA period | SMA current | SMA prev | SMA prev2 | | 5 day SMA | 33.68 | 33.61 | 33.56 | | 12 day SMA | 33.53 | 33.54 | 33.53 | | 20 day SMA | 33.62 | 33.62 | 33.62 | | 35 day SMA | 33.67 | 33.68 | 33.68 | | 50 day SMA | 33.79 | 33.79 | 33.79 | | 100 day SMA | 33.37 | 33.35 | 33.33 | | 150 day SMA | 32.8 | 32.8 | 32.8 | | 200 day SMA | 32.94 | 32.94 | 32.93 |
|
|
