Kld400 DSI full analysis,charts,indicators,moving averages,SMA,DMA,EMA,ADX,MACD,RSIKld 400 DSI WideScreen charts, DMA,SMA,EMA technical analysis, forecast prediction, by indicators ADX,MACD,RSI,CCI AMEX stock exchange
Daily price and charts and targets Kld400 Strong Daily Stock price targets for Kld400 DSI are 126.7 and 127.8 | Daily Target 1 | 125.82 | | Daily Target 2 | 126.47 | | Daily Target 3 | 126.91666666667 | | Daily Target 4 | 127.57 | | Daily Target 5 | 128.02 |
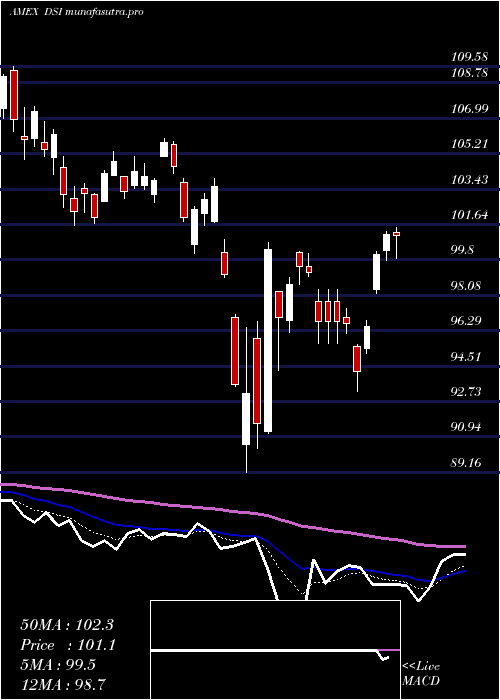
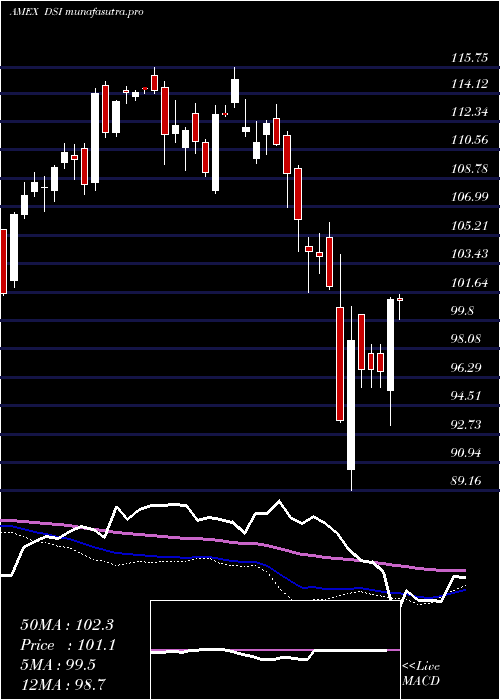
Daily price and volume Kld 400
| Date |
Closing |
Open |
Range |
Volume |
Thu 23 October 2025 |
127.13 (0.55%) |
126.36 |
126.26 - 127.36 |
0.6509 times |
Wed 22 October 2025 |
126.44 (-0.42%) |
127.02 |
125.64 - 127.33 |
0.5314 times |
Tue 21 October 2025 |
126.97 (0.06%) |
126.81 |
126.48 - 127.15 |
0.4796 times |
Mon 20 October 2025 |
126.90 (0.68%) |
126.36 |
126.36 - 127.06 |
0.6676 times |
Fri 17 October 2025 |
126.04 (0.68%) |
124.92 |
124.80 - 126.24 |
2.365 times |
Thu 16 October 2025 |
125.19 (-0.4%) |
126.12 |
124.64 - 126.48 |
2.1419 times |
Wed 15 October 2025 |
125.69 (0.39%) |
126.25 |
124.71 - 126.60 |
0.7809 times |
Tue 14 October 2025 |
125.20 (-0.31%) |
124.25 |
123.72 - 125.89 |
0.7215 times |
Mon 13 October 2025 |
125.59 (1.59%) |
125.09 |
124.85 - 125.76 |
0.7288 times |
Fri 10 October 2025 |
123.63 (-2.59%) |
127.18 |
123.63 - 127.48 |
0.9324 times |
Thu 09 October 2025 |
126.92 (-0.23%) |
127.40 |
126.66 - 127.44 |
0.8615 times |
Weekly price and charts Kld400 Strong weekly Stock price targets for Kld400 DSI are 126.39 and 128.11 | Weekly Target 1 | 124.99 | | Weekly Target 2 | 126.06 | | Weekly Target 3 | 126.71 | | Weekly Target 4 | 127.78 | | Weekly Target 5 | 128.43 |
Weekly price and volumes for Kld 400
| Date |
Closing |
Open |
Range |
Volume |
Thu 23 October 2025 |
127.13 (0.86%) |
126.36 |
125.64 - 127.36 |
0.5881 times |
Fri 17 October 2025 |
126.04 (1.95%) |
125.09 |
123.72 - 126.60 |
1.701 times |
Fri 10 October 2025 |
123.63 (-2.43%) |
127.23 |
123.63 - 127.76 |
0.8751 times |
Fri 03 October 2025 |
126.71 (1.62%) |
125.24 |
124.95 - 127.28 |
0.8689 times |
Fri 26 September 2025 |
124.69 (-0.26%) |
124.65 |
123.19 - 125.98 |
1.5187 times |
Fri 19 September 2025 |
125.02 (1.06%) |
124.10 |
122.88 - 125.22 |
1.3335 times |
Fri 12 September 2025 |
123.71 (2.09%) |
121.47 |
121.05 - 124.07 |
1.1645 times |
Fri 05 September 2025 |
121.18 (-0.18%) |
119.84 |
119.22 - 122.04 |
0.6225 times |
Fri 29 August 2025 |
121.40 (0%) |
121.93 |
121.02 - 121.97 |
0.2161 times |
Fri 29 August 2025 |
121.40 (-0.45%) |
121.83 |
121.02 - 122.48 |
1.1115 times |
Fri 22 August 2025 |
121.95 (0.73%) |
121.07 |
119.36 - 122.22 |
0.6414 times |
Monthly price and charts Kld400 Strong monthly Stock price targets for Kld400 DSI are 125.38 and 129.51 | Monthly Target 1 | 122.04 | | Monthly Target 2 | 124.59 | | Monthly Target 3 | 126.17333333333 | | Monthly Target 4 | 128.72 | | Monthly Target 5 | 130.3 |
Monthly price and volumes Kld 400
| Date |
Closing |
Open |
Range |
Volume |
Thu 23 October 2025 |
127.13 (0.94%) |
125.38 |
123.63 - 127.76 |
0.7021 times |
Tue 30 September 2025 |
125.95 (3.75%) |
119.84 |
119.22 - 126.03 |
0.9838 times |
Fri 29 August 2025 |
121.40 (1.32%) |
118.77 |
117.52 - 122.48 |
0.6608 times |
Thu 31 July 2025 |
119.82 (3.15%) |
115.51 |
115.51 - 121.77 |
0.7909 times |
Mon 30 June 2025 |
116.16 (4.83%) |
110.42 |
109.80 - 116.38 |
0.7567 times |
Fri 30 May 2025 |
110.81 (8.87%) |
103.46 |
102.89 - 112.02 |
1.1724 times |
Wed 30 April 2025 |
101.78 (-0.62%) |
102.18 |
89.16 - 103.97 |
1.3417 times |
Mon 31 March 2025 |
102.41 (-6.13%) |
109.39 |
100.20 - 109.58 |
1.1114 times |
Fri 28 February 2025 |
109.10 (-2.59%) |
110.01 |
106.97 - 113.39 |
1.021 times |
Fri 31 January 2025 |
112.00 (1.59%) |
110.89 |
107.82 - 115.71 |
1.4592 times |
Tue 31 December 2024 |
110.25 (-3.45%) |
114.42 |
109.62 - 115.75 |
0.8128 times |

DMA SMA EMA moving averages of Kld 400 DSI
DMA (daily moving average) of Kld 400 DSI
| DMA period | DMA value | | 5 day DMA | 126.7 | | 12 day DMA | 126.08 | | 20 day DMA | 126.14 | | 35 day DMA | 125.08 | | 50 day DMA | 123.93 | | 100 day DMA | 120.33 | | 150 day DMA | 114.66 | | 200 day DMA | 113.48 | EMA (exponential moving average) of Kld 400 DSI
| EMA period | EMA current | EMA prev | EMA prev2 | | 5 day EMA | 126.64 | 126.39 | 126.37 | | 12 day EMA | 126.25 | 126.09 | 126.03 | | 20 day EMA | 125.86 | 125.73 | 125.66 | | 35 day EMA | 124.94 | 124.81 | 124.71 | | 50 day EMA | 123.97 | 123.84 | 123.73 |
SMA (simple moving average) of Kld 400 DSI
| SMA period | SMA current | SMA prev | SMA prev2 | | 5 day SMA | 126.7 | 126.31 | 126.16 | | 12 day SMA | 126.08 | 126.02 | 126.11 | | 20 day SMA | 126.14 | 125.97 | 125.88 | | 35 day SMA | 125.08 | 124.93 | 124.77 | | 50 day SMA | 123.93 | 123.82 | 123.72 | | 100 day SMA | 120.33 | 120.17 | 120.02 | | 150 day SMA | 114.66 | 114.5 | 114.35 | | 200 day SMA | 113.48 | 113.41 | 113.34 |
|
|
