RealEstate DRV full analysis,charts,indicators,moving averages,SMA,DMA,EMA,ADX,MACD,RSIReal Estate DRV WideScreen charts, DMA,SMA,EMA technical analysis, forecast prediction, by indicators ADX,MACD,RSI,CCI AMEX stock exchange
Daily price and charts and targets RealEstate Strong Daily Stock price targets for RealEstate DRV are 23.05 and 24.05 | Daily Target 1 | 22.32 | | Daily Target 2 | 22.78 | | Daily Target 3 | 23.316666666667 | | Daily Target 4 | 23.78 | | Daily Target 5 | 24.32 |
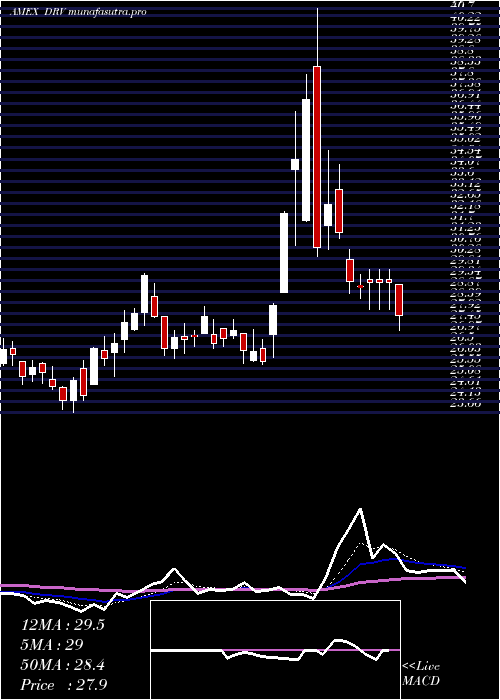
Daily price and volume Real Estate
| Date |
Closing |
Open |
Range |
Volume |
Thu 23 October 2025 |
23.25 (0.13%) |
23.00 |
22.85 - 23.85 |
1.0098 times |
Wed 22 October 2025 |
23.22 (-1.11%) |
23.33 |
23.03 - 23.54 |
0.4746 times |
Tue 21 October 2025 |
23.48 (1.08%) |
23.50 |
23.03 - 23.60 |
0.8694 times |
Mon 20 October 2025 |
23.23 (-3.13%) |
23.76 |
23.21 - 23.80 |
1.2483 times |
Fri 17 October 2025 |
23.98 (-1.72%) |
25.01 |
23.83 - 25.01 |
0.4289 times |
Thu 16 October 2025 |
24.40 (0.95%) |
23.92 |
23.78 - 24.61 |
1.3041 times |
Wed 15 October 2025 |
24.17 (-3.55%) |
24.99 |
23.93 - 25.05 |
2.1539 times |
Tue 14 October 2025 |
25.06 (-3.87%) |
26.09 |
25.06 - 26.21 |
1.1417 times |
Mon 13 October 2025 |
26.07 (-1.25%) |
26.24 |
25.93 - 26.60 |
0.5032 times |
Fri 10 October 2025 |
26.40 (3.21%) |
25.36 |
25.34 - 26.52 |
0.8659 times |
Thu 09 October 2025 |
25.58 (1.59%) |
25.19 |
25.06 - 25.73 |
0.4549 times |
Weekly price and charts RealEstate Strong weekly Stock price targets for RealEstate DRV are 22.55 and 23.55 | Weekly Target 1 | 22.32 | | Weekly Target 2 | 22.78 | | Weekly Target 3 | 23.316666666667 | | Weekly Target 4 | 23.78 | | Weekly Target 5 | 24.32 |
Weekly price and volumes for Real Estate
| Date |
Closing |
Open |
Range |
Volume |
Thu 23 October 2025 |
23.25 (-3.04%) |
23.76 |
22.85 - 23.85 |
1.3549 times |
Fri 17 October 2025 |
23.98 (-9.17%) |
26.24 |
23.78 - 26.60 |
2.0808 times |
Fri 10 October 2025 |
26.40 (10.6%) |
23.63 |
23.63 - 26.52 |
1.2344 times |
Fri 03 October 2025 |
23.87 (-1%) |
23.97 |
23.30 - 24.45 |
0.9079 times |
Fri 26 September 2025 |
24.11 (-3.09%) |
24.79 |
23.80 - 25.24 |
1.0549 times |
Fri 19 September 2025 |
24.88 (3.8%) |
23.75 |
23.42 - 24.88 |
0.9423 times |
Fri 12 September 2025 |
23.97 (-1.03%) |
24.88 |
23.47 - 25.29 |
0.7952 times |
Fri 05 September 2025 |
24.22 (1.09%) |
24.49 |
23.83 - 25.67 |
0.7567 times |
Fri 29 August 2025 |
23.96 (0%) |
24.22 |
23.96 - 24.31 |
0.0693 times |
Fri 29 August 2025 |
23.96 (0.63%) |
24.00 |
23.79 - 24.69 |
0.8037 times |
Fri 22 August 2025 |
23.81 (-7.21%) |
25.76 |
23.42 - 26.43 |
1.6676 times |

Monthly price and charts RealEstate Strong monthly Stock price targets for RealEstate DRV are 21.18 and 24.93 | Monthly Target 1 | 20.48 | | Monthly Target 2 | 21.87 | | Monthly Target 3 | 24.233333333333 | | Monthly Target 4 | 25.62 | | Monthly Target 5 | 27.98 |
Monthly price and volumes Real Estate
| Date |
Closing |
Open |
Range |
Volume |
Thu 23 October 2025 |
23.25 (-1.86%) |
23.70 |
22.85 - 26.60 |
0.7521 times |
Tue 30 September 2025 |
23.69 (-1.13%) |
24.49 |
23.42 - 25.67 |
0.5774 times |
Fri 29 August 2025 |
23.96 (-5.56%) |
24.99 |
23.42 - 26.80 |
0.6446 times |
Thu 31 July 2025 |
25.37 (0.59%) |
25.22 |
22.83 - 25.86 |
0.8658 times |
Mon 30 June 2025 |
25.22 (-0.79%) |
26.05 |
23.56 - 26.97 |
0.6972 times |
Fri 30 May 2025 |
25.42 (-2.61%) |
25.87 |
24.56 - 28.13 |
1.0863 times |
Wed 30 April 2025 |
26.10 (-0.95%) |
25.91 |
25.73 - 41.00 |
1.7966 times |
Mon 31 March 2025 |
26.35 (6.29%) |
24.75 |
23.66 - 29.64 |
1.0191 times |
Fri 28 February 2025 |
24.79 (-10.8%) |
28.77 |
24.66 - 29.33 |
0.9306 times |
Fri 31 January 2025 |
27.79 (-5.7%) |
29.63 |
26.71 - 33.34 |
1.6304 times |
Tue 31 December 2024 |
29.47 (29.14%) |
23.82 |
23.64 - 32.21 |
0.9731 times |

DMA SMA EMA moving averages of Real Estate DRV
DMA (daily moving average) of Real Estate DRV
| DMA period | DMA value | | 5 day DMA | 23.43 | | 12 day DMA | 24.5 | | 20 day DMA | 24.35 | | 35 day DMA | 24.39 | | 50 day DMA | 24.49 | | 100 day DMA | 24.73 | | 150 day DMA | 25.68 | | 200 day DMA | 26.13 | EMA (exponential moving average) of Real Estate DRV
| EMA period | EMA current | EMA prev | EMA prev2 | | 5 day EMA | 23.53 | 23.67 | 23.89 | | 12 day EMA | 24.02 | 24.16 | 24.33 | | 20 day EMA | 24.24 | 24.34 | 24.46 | | 35 day EMA | 24.43 | 24.5 | 24.58 | | 50 day EMA | 24.51 | 24.56 | 24.61 |
SMA (simple moving average) of Real Estate DRV
| SMA period | SMA current | SMA prev | SMA prev2 | | 5 day SMA | 23.43 | 23.66 | 23.85 | | 12 day SMA | 24.5 | 24.63 | 24.75 | | 20 day SMA | 24.35 | 24.42 | 24.5 | | 35 day SMA | 24.39 | 24.43 | 24.49 | | 50 day SMA | 24.49 | 24.55 | 24.6 | | 100 day SMA | 24.73 | 24.75 | 24.77 | | 150 day SMA | 25.68 | 25.7 | 25.72 | | 200 day SMA | 26.13 | 26.17 | 26.19 |
|
|
