RealEstate DRN full analysis,charts,indicators,moving averages,SMA,DMA,EMA,ADX,MACD,RSIReal Estate DRN WideScreen charts, DMA,SMA,EMA technical analysis, forecast prediction, by indicators ADX,MACD,RSI,CCI AMEX stock exchange
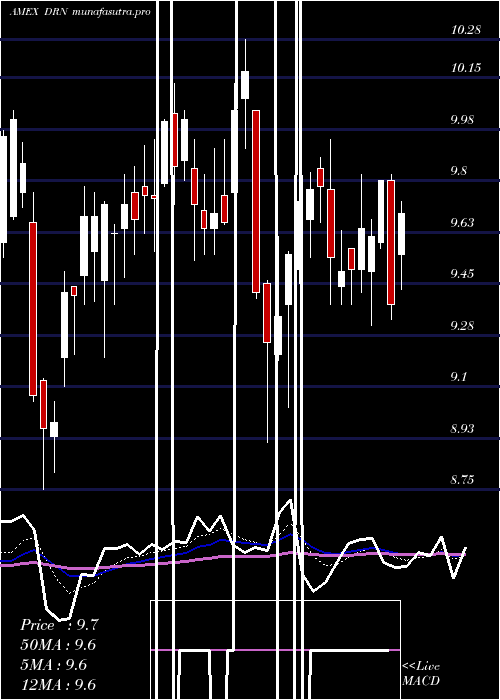
Daily price and charts and targets RealEstate Strong Daily Stock price targets for RealEstate DRN are 9.99 and 10.28 | Daily Target 1 | 9.77 | | Daily Target 2 | 9.91 | | Daily Target 3 | 10.06 | | Daily Target 4 | 10.2 | | Daily Target 5 | 10.35 |
Daily price and volume Real Estate
| Date |
Closing |
Open |
Range |
Volume |
Fri 24 October 2025 |
10.05 (0.9%) |
9.92 |
9.92 - 10.21 |
0.8496 times |
Thu 23 October 2025 |
9.96 (-0.3%) |
10.04 |
9.70 - 10.12 |
0.9443 times |
Wed 22 October 2025 |
9.99 (1.32%) |
9.86 |
9.70 - 10.04 |
0.7938 times |
Tue 21 October 2025 |
9.86 (-1%) |
9.90 |
9.79 - 10.04 |
0.587 times |
Mon 20 October 2025 |
9.96 (3.11%) |
9.46 |
9.46 - 9.96 |
0.6251 times |
Fri 17 October 2025 |
9.66 (1.68%) |
9.35 |
9.29 - 9.70 |
0.6866 times |
Thu 16 October 2025 |
9.50 (-0.84%) |
9.58 |
9.36 - 9.75 |
1.3488 times |
Wed 15 October 2025 |
9.58 (4.7%) |
9.28 |
9.25 - 9.67 |
1.6351 times |
Tue 14 October 2025 |
9.15 (2.46%) |
8.85 |
8.85 - 9.22 |
1.4303 times |
Mon 13 October 2025 |
8.93 (1.71%) |
8.82 |
8.74 - 8.95 |
1.0996 times |
Fri 10 October 2025 |
8.78 (-3.41%) |
9.15 |
8.75 - 9.20 |
1.7731 times |
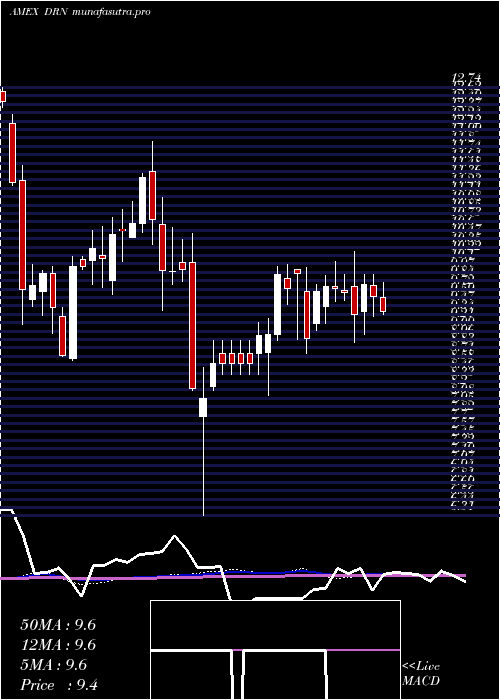
Weekly price and charts RealEstate Strong weekly Stock price targets for RealEstate DRN are 9.76 and 10.51 | Weekly Target 1 | 9.16 | | Weekly Target 2 | 9.6 | | Weekly Target 3 | 9.9066666666667 | | Weekly Target 4 | 10.35 | | Weekly Target 5 | 10.66 |
Weekly price and volumes for Real Estate
| Date |
Closing |
Open |
Range |
Volume |
Fri 24 October 2025 |
10.05 (4.04%) |
9.46 |
9.46 - 10.21 |
0.8065 times |
Fri 17 October 2025 |
9.66 (10.02%) |
8.82 |
8.74 - 9.75 |
1.316 times |
Fri 10 October 2025 |
8.78 (-10.04%) |
9.79 |
8.75 - 9.80 |
1.4823 times |
Fri 03 October 2025 |
9.76 (1.24%) |
9.69 |
9.49 - 9.97 |
0.9002 times |
Fri 26 September 2025 |
9.64 (1.69%) |
9.47 |
9.33 - 9.77 |
0.8777 times |
Fri 19 September 2025 |
9.48 (-3.56%) |
9.91 |
9.47 - 10.04 |
1.4241 times |
Fri 12 September 2025 |
9.83 (0.82%) |
9.40 |
9.32 - 10.04 |
1.2257 times |
Fri 05 September 2025 |
9.75 (-1.22%) |
9.59 |
9.20 - 9.90 |
1.0066 times |
Fri 29 August 2025 |
9.87 (0%) |
9.72 |
9.72 - 9.88 |
0.1474 times |
Fri 29 August 2025 |
9.87 (-0.6%) |
9.91 |
9.58 - 9.98 |
0.8134 times |
Fri 22 August 2025 |
9.93 (7%) |
9.28 |
9.00 - 10.09 |
1.4904 times |
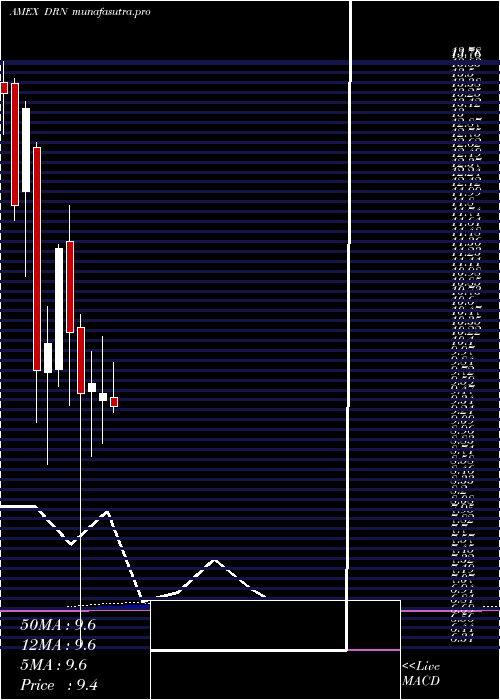
Monthly price and charts RealEstate Strong monthly Stock price targets for RealEstate DRN are 9.4 and 10.87 | Monthly Target 1 | 8.2 | | Monthly Target 2 | 9.12 | | Monthly Target 3 | 9.6666666666667 | | Monthly Target 4 | 10.59 | | Monthly Target 5 | 11.14 |
Monthly price and volumes Real Estate
| Date |
Closing |
Open |
Range |
Volume |
Fri 24 October 2025 |
10.05 (2.66%) |
9.81 |
8.74 - 10.21 |
0.765 times |
Tue 30 September 2025 |
9.79 (-0.81%) |
9.59 |
9.20 - 10.04 |
0.8992 times |
Fri 29 August 2025 |
9.87 (5%) |
9.68 |
8.88 - 10.09 |
0.817 times |
Thu 31 July 2025 |
9.40 (-1.57%) |
9.50 |
9.31 - 10.54 |
0.7585 times |
Mon 30 June 2025 |
9.55 (-1.34%) |
9.46 |
8.91 - 10.28 |
0.6699 times |
Fri 30 May 2025 |
9.68 (1.36%) |
9.57 |
8.75 - 10.08 |
0.7314 times |
Wed 30 April 2025 |
9.55 (-7.46%) |
10.39 |
6.31 - 10.55 |
1.5005 times |
Mon 31 March 2025 |
10.32 (-9.47%) |
11.48 |
9.39 - 11.94 |
1.1244 times |
Fri 28 February 2025 |
11.40 (11.98%) |
9.85 |
9.64 - 11.45 |
0.9173 times |
Fri 31 January 2025 |
10.18 (3.46%) |
9.82 |
8.64 - 10.66 |
1.8168 times |
Tue 31 December 2024 |
9.84 (-25.34%) |
12.68 |
9.18 - 12.74 |
1.1721 times |
DMA SMA EMA moving averages of Real Estate DRN
DMA (daily moving average) of Real Estate DRN
| DMA period | DMA value | | 5 day DMA | 9.96 | | 12 day DMA | 9.54 | | 20 day DMA | 9.56 | | 35 day DMA | 9.59 | | 50 day DMA | 9.59 | | 100 day DMA | 9.64 | | 150 day DMA | 9.49 | | 200 day DMA | 9.73 | EMA (exponential moving average) of Real Estate DRN
| EMA period | EMA current | EMA prev | EMA prev2 | | 5 day EMA | 9.92 | 9.85 | 9.8 | | 12 day EMA | 9.73 | 9.67 | 9.62 | | 20 day EMA | 9.64 | 9.6 | 9.56 | | 35 day EMA | 9.58 | 9.55 | 9.53 | | 50 day EMA | 9.6 | 9.58 | 9.56 |
SMA (simple moving average) of Real Estate DRN
| SMA period | SMA current | SMA prev | SMA prev2 | | 5 day SMA | 9.96 | 9.89 | 9.79 | | 12 day SMA | 9.54 | 9.48 | 9.43 | | 20 day SMA | 9.56 | 9.54 | 9.51 | | 35 day SMA | 9.59 | 9.58 | 9.56 | | 50 day SMA | 9.59 | 9.58 | 9.56 | | 100 day SMA | 9.64 | 9.63 | 9.63 | | 150 day SMA | 9.49 | 9.49 | 9.49 | | 200 day SMA | 9.73 | 9.72 | 9.72 |
|
|
