IntlLargecap DOL full analysis,charts,indicators,moving averages,SMA,DMA,EMA,ADX,MACD,RSIIntl Largecap DOL WideScreen charts, DMA,SMA,EMA technical analysis, forecast prediction, by indicators ADX,MACD,RSI,CCI AMEX stock exchange
Daily price and charts and targets IntlLargecap Strong Daily Stock price targets for IntlLargecap DOL are 62.98 and 63.19 | Daily Target 1 | 62.82 | | Daily Target 2 | 62.93 | | Daily Target 3 | 63.03 | | Daily Target 4 | 63.14 | | Daily Target 5 | 63.24 |
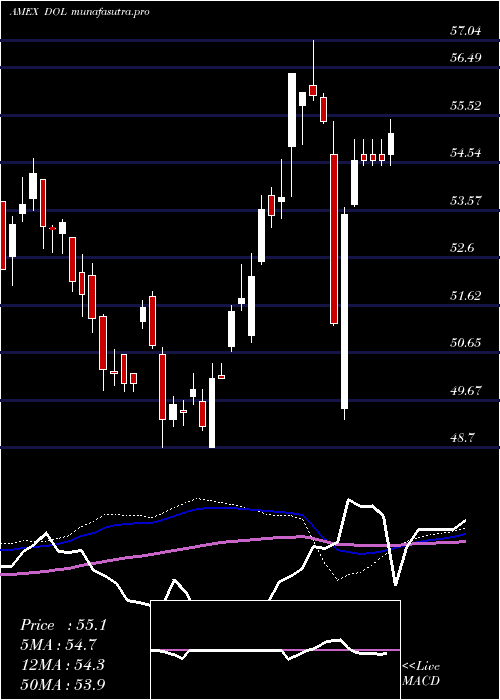
Daily price and volume Intl Largecap
| Date |
Closing |
Open |
Range |
Volume |
Thu 23 October 2025 |
63.04 (0.37%) |
63.01 |
62.92 - 63.13 |
0.5168 times |
Wed 22 October 2025 |
62.81 (0.08%) |
62.73 |
62.65 - 63.04 |
0.9536 times |
Tue 21 October 2025 |
62.76 (-0.77%) |
62.91 |
62.76 - 63.02 |
1.0292 times |
Mon 20 October 2025 |
63.25 (0.68%) |
63.12 |
62.99 - 63.25 |
0.525 times |
Fri 17 October 2025 |
62.82 (0.18%) |
62.58 |
62.51 - 62.87 |
0.571 times |
Thu 16 October 2025 |
62.71 (0.69%) |
62.58 |
62.49 - 62.86 |
0.7039 times |
Wed 15 October 2025 |
62.28 (0.21%) |
62.27 |
62.06 - 62.41 |
1.1015 times |
Tue 14 October 2025 |
62.15 (0.75%) |
61.51 |
61.51 - 62.26 |
0.9005 times |
Mon 13 October 2025 |
61.69 (0.67%) |
61.43 |
61.43 - 61.73 |
2.2352 times |
Fri 10 October 2025 |
61.28 (-1.27%) |
62.04 |
61.27 - 62.09 |
1.4633 times |
Thu 09 October 2025 |
62.07 (-1.05%) |
62.63 |
61.97 - 62.63 |
1.2543 times |

Weekly price and charts IntlLargecap Strong weekly Stock price targets for IntlLargecap DOL are 62.55 and 63.15 | Weekly Target 1 | 62.38 | | Weekly Target 2 | 62.71 | | Weekly Target 3 | 62.98 | | Weekly Target 4 | 63.31 | | Weekly Target 5 | 63.58 |
Weekly price and volumes for Intl Largecap
| Date |
Closing |
Open |
Range |
Volume |
Thu 23 October 2025 |
63.04 (0.35%) |
63.12 |
62.65 - 63.25 |
0.4424 times |
Fri 17 October 2025 |
62.82 (2.51%) |
61.43 |
61.43 - 62.87 |
0.8063 times |
Fri 10 October 2025 |
61.28 (-2.93%) |
63.10 |
61.27 - 63.15 |
1.1045 times |
Fri 03 October 2025 |
63.13 (2.15%) |
61.93 |
61.74 - 63.27 |
0.7009 times |
Fri 26 September 2025 |
61.80 (-0.4%) |
62.09 |
61.04 - 62.44 |
1.8194 times |
Fri 19 September 2025 |
62.05 (-0.58%) |
62.69 |
61.96 - 62.86 |
1.7406 times |
Fri 12 September 2025 |
62.41 (1%) |
62.13 |
61.96 - 63.04 |
0.8091 times |
Fri 05 September 2025 |
61.79 (0.23%) |
60.84 |
60.84 - 62.07 |
1.2031 times |
Fri 29 August 2025 |
61.65 (0%) |
61.55 |
61.53 - 61.69 |
0.1835 times |
Fri 29 August 2025 |
61.65 (-2.05%) |
62.52 |
61.31 - 62.89 |
1.1902 times |
Fri 22 August 2025 |
62.94 (1.29%) |
61.77 |
61.70 - 63.07 |
1.3619 times |
Monthly price and charts IntlLargecap Strong monthly Stock price targets for IntlLargecap DOL are 62.16 and 64.16 | Monthly Target 1 | 60.53 | | Monthly Target 2 | 61.78 | | Monthly Target 3 | 62.526666666667 | | Monthly Target 4 | 63.78 | | Monthly Target 5 | 64.53 |
Monthly price and volumes Intl Largecap
| Date |
Closing |
Open |
Range |
Volume |
Thu 23 October 2025 |
63.04 (1.27%) |
62.54 |
61.27 - 63.27 |
0.525 times |
Tue 30 September 2025 |
62.25 (0.97%) |
60.84 |
60.84 - 63.04 |
1.0905 times |
Fri 29 August 2025 |
61.65 (4.6%) |
58.76 |
58.47 - 63.07 |
0.9861 times |
Thu 31 July 2025 |
58.94 (-1.06%) |
59.50 |
58.66 - 61.28 |
1.1065 times |
Mon 30 June 2025 |
59.57 (0.3%) |
59.45 |
58.29 - 61.24 |
1.179 times |
Fri 30 May 2025 |
59.39 (3.86%) |
57.25 |
56.87 - 59.75 |
0.9515 times |
Wed 30 April 2025 |
57.18 (3.83%) |
55.22 |
49.29 - 57.46 |
1.3154 times |
Mon 31 March 2025 |
55.07 (2.32%) |
54.87 |
53.84 - 57.04 |
1.2498 times |
Fri 28 February 2025 |
53.82 (3.98%) |
51.00 |
50.86 - 54.60 |
0.731 times |
Fri 31 January 2025 |
51.76 (4.69%) |
49.44 |
48.70 - 52.46 |
0.8653 times |
Tue 31 December 2024 |
49.44 (-1.14%) |
51.30 |
48.70 - 51.91 |
0.8678 times |

DMA SMA EMA moving averages of Intl Largecap DOL
DMA (daily moving average) of Intl Largecap DOL
| DMA period | DMA value | | 5 day DMA | 62.94 | | 12 day DMA | 62.47 | | 20 day DMA | 62.49 | | 35 day DMA | 62.36 | | 50 day DMA | 62.22 | | 100 day DMA | 61.02 | | 150 day DMA | 59.42 | | 200 day DMA | 57.82 | EMA (exponential moving average) of Intl Largecap DOL
| EMA period | EMA current | EMA prev | EMA prev2 | | 5 day EMA | 62.86 | 62.77 | 62.75 | | 12 day EMA | 62.64 | 62.57 | 62.53 | | 20 day EMA | 62.52 | 62.47 | 62.43 | | 35 day EMA | 62.35 | 62.31 | 62.28 | | 50 day EMA | 62.22 | 62.19 | 62.16 |
SMA (simple moving average) of Intl Largecap DOL
| SMA period | SMA current | SMA prev | SMA prev2 | | 5 day SMA | 62.94 | 62.87 | 62.76 | | 12 day SMA | 62.47 | 62.43 | 62.45 | | 20 day SMA | 62.49 | 62.4 | 62.35 | | 35 day SMA | 62.36 | 62.32 | 62.27 | | 50 day SMA | 62.22 | 62.2 | 62.18 | | 100 day SMA | 61.02 | 60.98 | 60.94 | | 150 day SMA | 59.42 | 59.37 | 59.33 | | 200 day SMA | 57.82 | 57.76 | 57.69 |
|
|
