GuggenheimDow DJD full analysis,charts,indicators,moving averages,SMA,DMA,EMA,ADX,MACD,RSIGuggenheim Dow DJD WideScreen charts, DMA,SMA,EMA technical analysis, forecast prediction, by indicators ADX,MACD,RSI,CCI AMEX stock exchange
Daily price and charts and targets GuggenheimDow Strong Daily Stock price targets for GuggenheimDow DJD are 55.73 and 55.97 | Daily Target 1 | 55.55 | | Daily Target 2 | 55.67 | | Daily Target 3 | 55.786666666667 | | Daily Target 4 | 55.91 | | Daily Target 5 | 56.03 |
Daily price and volume Guggenheim Dow
| Date |
Closing |
Open |
Range |
Volume |
Fri 24 October 2025 |
55.80 (0.67%) |
55.72 |
55.66 - 55.90 |
0.6515 times |
Thu 23 October 2025 |
55.43 (-0.22%) |
55.48 |
55.40 - 55.58 |
0.3396 times |
Wed 22 October 2025 |
55.55 (-0.41%) |
55.69 |
55.51 - 55.86 |
0.7741 times |
Tue 21 October 2025 |
55.78 (0.49%) |
55.55 |
55.54 - 55.87 |
2.1271 times |
Mon 20 October 2025 |
55.51 (0.93%) |
55.15 |
55.15 - 55.52 |
1.0399 times |
Fri 17 October 2025 |
55.00 (0.73%) |
54.58 |
54.58 - 55.11 |
1.3834 times |
Thu 16 October 2025 |
54.60 (-0.49%) |
54.90 |
54.50 - 54.98 |
0.5509 times |
Wed 15 October 2025 |
54.87 (0.04%) |
54.88 |
54.71 - 55.32 |
0.9136 times |
Tue 14 October 2025 |
54.85 (0.81%) |
54.13 |
54.03 - 54.95 |
1.192 times |
Mon 13 October 2025 |
54.41 (0.61%) |
54.20 |
54.20 - 54.51 |
1.0278 times |
Fri 10 October 2025 |
54.08 (-1.42%) |
55.06 |
54.01 - 55.14 |
2.5125 times |
Weekly price and charts GuggenheimDow Strong weekly Stock price targets for GuggenheimDow DJD are 55.48 and 56.23 | Weekly Target 1 | 54.87 | | Weekly Target 2 | 55.33 | | Weekly Target 3 | 55.616666666667 | | Weekly Target 4 | 56.08 | | Weekly Target 5 | 56.37 |
Weekly price and volumes for Guggenheim Dow
| Date |
Closing |
Open |
Range |
Volume |
Fri 24 October 2025 |
55.80 (1.45%) |
55.15 |
55.15 - 55.90 |
0.7873 times |
Fri 17 October 2025 |
55.00 (1.7%) |
54.20 |
54.03 - 55.32 |
0.8089 times |
Fri 10 October 2025 |
54.08 (-3.08%) |
55.82 |
54.01 - 55.82 |
1.3313 times |
Fri 03 October 2025 |
55.80 (2.01%) |
54.82 |
54.51 - 56.14 |
2.1038 times |
Fri 26 September 2025 |
54.70 (-1.01%) |
54.54 |
54.43 - 55.01 |
1.0653 times |
Fri 19 September 2025 |
55.26 (0.53%) |
55.00 |
54.72 - 55.54 |
1.0926 times |
Fri 12 September 2025 |
54.97 (0.48%) |
54.57 |
54.36 - 55.42 |
0.9138 times |
Fri 05 September 2025 |
54.71 (-0.4%) |
54.71 |
54.34 - 55.11 |
0.6335 times |
Fri 29 August 2025 |
54.93 (0%) |
54.91 |
54.81 - 54.96 |
0.1755 times |
Fri 29 August 2025 |
54.93 (-0.45%) |
55.20 |
54.59 - 55.20 |
1.0881 times |
Fri 22 August 2025 |
55.18 (1.85%) |
54.22 |
54.15 - 55.37 |
1.0357 times |
Monthly price and charts GuggenheimDow Strong monthly Stock price targets for GuggenheimDow DJD are 54.91 and 57.04 | Monthly Target 1 | 53.19 | | Monthly Target 2 | 54.49 | | Monthly Target 3 | 55.316666666667 | | Monthly Target 4 | 56.62 | | Monthly Target 5 | 57.45 |
Monthly price and volumes Guggenheim Dow
| Date |
Closing |
Open |
Range |
Volume |
Fri 24 October 2025 |
55.80 (1.05%) |
55.21 |
54.01 - 56.14 |
0.8564 times |
Tue 30 September 2025 |
55.22 (0.53%) |
54.71 |
54.34 - 55.54 |
0.7375 times |
Fri 29 August 2025 |
54.93 (3.5%) |
52.98 |
52.67 - 55.37 |
1.6747 times |
Thu 31 July 2025 |
53.07 (-0.23%) |
53.13 |
52.87 - 54.40 |
0.6362 times |
Mon 30 June 2025 |
53.19 (2.56%) |
51.72 |
51.30 - 53.19 |
0.7766 times |
Fri 30 May 2025 |
51.86 (2.45%) |
50.44 |
50.22 - 52.27 |
0.6608 times |
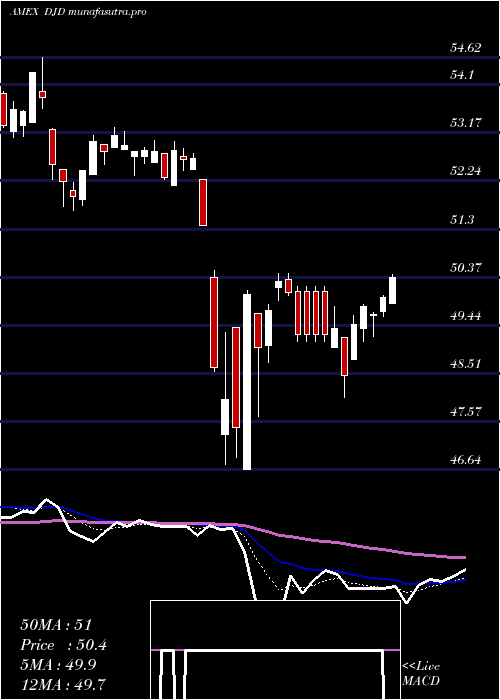
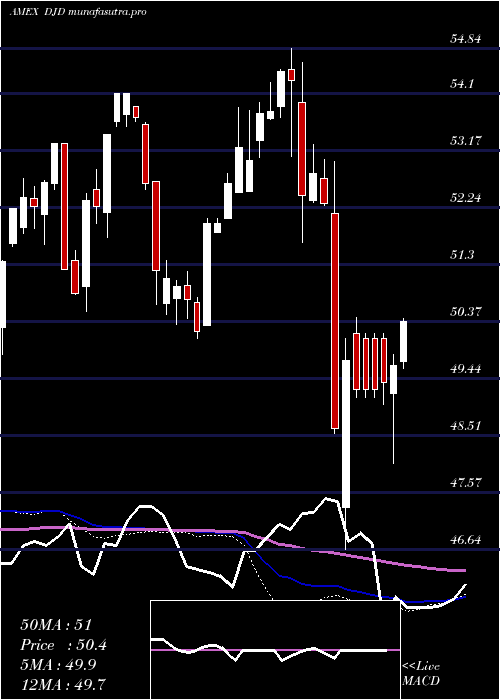
Wed 30 April 2025 |
50.62 (-4.18%) |
52.70 |
46.64 - 52.86 |
1.4689 times |
Mon 31 March 2025 |
52.83 (-3.03%) |
54.51 |
51.67 - 54.84 |
1.2128 times |
Fri 28 February 2025 |
54.48 (2.35%) |
52.50 |
52.50 - 54.50 |
0.8107 times |
Fri 31 January 2025 |
53.23 (4.97%) |
51.04 |
50.10 - 53.88 |
1.1656 times |
Tue 31 December 2024 |
50.71 (-6.28%) |
53.90 |
50.33 - 53.90 |
0.6744 times |

DMA SMA EMA moving averages of Guggenheim Dow DJD
DMA (daily moving average) of Guggenheim Dow DJD
| DMA period | DMA value | | 5 day DMA | 55.61 | | 12 day DMA | 55.06 | | 20 day DMA | 55.18 | | 35 day DMA | 55.05 | | 50 day DMA | 54.96 | | 100 day DMA | 54.05 | | 150 day DMA | 52.94 | | 200 day DMA | 52.96 | EMA (exponential moving average) of Guggenheim Dow DJD
| EMA period | EMA current | EMA prev | EMA prev2 | | 5 day EMA | 55.53 | 55.4 | 55.38 | | 12 day EMA | 55.29 | 55.2 | 55.16 | | 20 day EMA | 55.18 | 55.12 | 55.09 | | 35 day EMA | 55.04 | 55 | 54.97 | | 50 day EMA | 54.94 | 54.91 | 54.89 |
SMA (simple moving average) of Guggenheim Dow DJD
| SMA period | SMA current | SMA prev | SMA prev2 | | 5 day SMA | 55.61 | 55.45 | 55.29 | | 12 day SMA | 55.06 | 55.01 | 55 | | 20 day SMA | 55.18 | 55.12 | 55.07 | | 35 day SMA | 55.05 | 55.02 | 55.01 | | 50 day SMA | 54.96 | 54.93 | 54.9 | | 100 day SMA | 54.05 | 54.01 | 53.98 | | 150 day SMA | 52.94 | 52.92 | 52.91 | | 200 day SMA | 52.96 | 52.94 | 52.91 |
|
|
