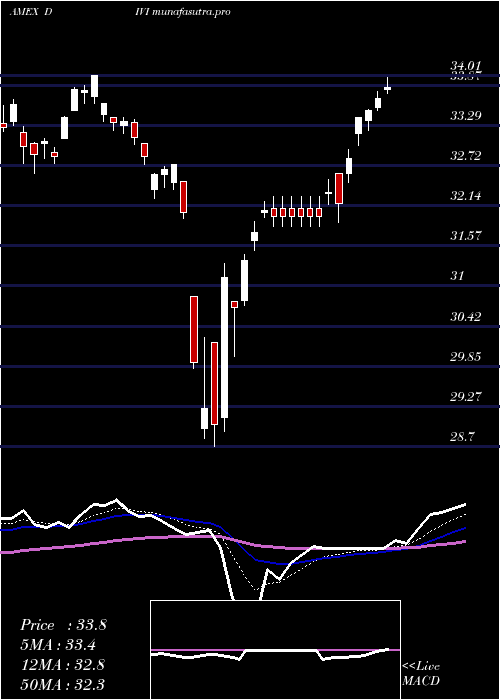
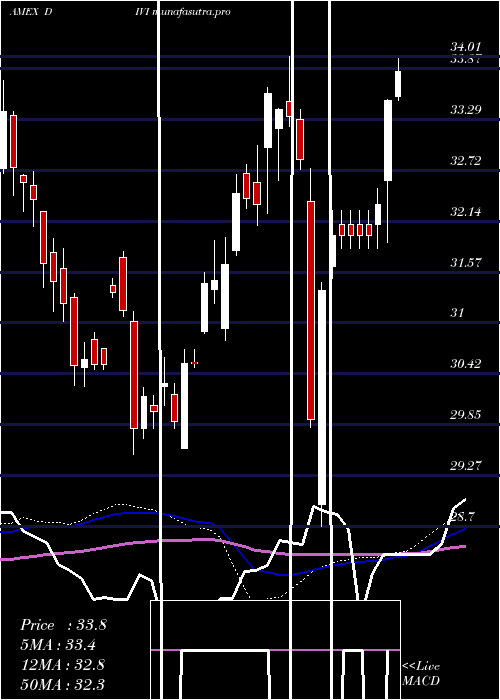
AdvisorsharesAthena DIVI full analysis,charts,indicators,moving averages,SMA,DMA,EMA,ADX,MACD,RSIAdvisorshares Athena DIVI WideScreen charts, DMA,SMA,EMA technical analysis, forecast prediction, by indicators ADX,MACD,RSI,CCI AMEX stock exchange
Daily price and charts and targets AdvisorsharesAthena Strong Daily Stock price targets for AdvisorsharesAthena DIVI are 37.92 and 38.04 | Daily Target 1 | 37.89 | | Daily Target 2 | 37.95 | | Daily Target 3 | 38.01 | | Daily Target 4 | 38.07 | | Daily Target 5 | 38.13 |
Daily price and volume Advisorshares Athena
| Date |
Closing |
Open |
Range |
Volume |
Fri 24 October 2025 |
38.01 (0.13%) |
38.07 |
37.95 - 38.07 |
0.6517 times |
Thu 23 October 2025 |
37.96 (0.5%) |
37.83 |
37.83 - 38.00 |
1.213 times |
Wed 22 October 2025 |
37.77 (-0.03%) |
37.80 |
37.62 - 37.89 |
0.7759 times |
Tue 21 October 2025 |
37.78 (-0.66%) |
38.09 |
37.74 - 38.09 |
1.093 times |
Mon 20 October 2025 |
38.03 (0.69%) |
37.89 |
37.89 - 38.09 |
0.5777 times |
Fri 17 October 2025 |
37.77 (0.29%) |
37.62 |
37.55 - 37.81 |
1.4416 times |
Thu 16 October 2025 |
37.66 (0.45%) |
37.66 |
37.58 - 37.87 |
1.2553 times |
Wed 15 October 2025 |
37.49 (0.54%) |
37.52 |
37.31 - 37.62 |
1.1774 times |
Tue 14 October 2025 |
37.29 (0.62%) |
36.92 |
36.79 - 37.41 |
1.0543 times |
Mon 13 October 2025 |
37.06 (0.82%) |
36.92 |
36.92 - 37.15 |
0.7599 times |
Fri 10 October 2025 |
36.76 (-1.95%) |
37.44 |
36.75 - 37.44 |
0.8368 times |
Weekly price and charts AdvisorsharesAthena Strong weekly Stock price targets for AdvisorsharesAthena DIVI are 37.82 and 38.29 | Weekly Target 1 | 37.44 | | Weekly Target 2 | 37.72 | | Weekly Target 3 | 37.906666666667 | | Weekly Target 4 | 38.19 | | Weekly Target 5 | 38.38 |
Weekly price and volumes for Advisorshares Athena
| Date |
Closing |
Open |
Range |
Volume |
Fri 24 October 2025 |
38.01 (0.64%) |
37.89 |
37.62 - 38.09 |
0.7848 times |
Fri 17 October 2025 |
37.77 (2.75%) |
36.92 |
36.79 - 37.87 |
1.0355 times |
Fri 10 October 2025 |
36.76 (-3.31%) |
38.02 |
36.75 - 38.11 |
0.8597 times |
Fri 03 October 2025 |
38.02 (2.56%) |
37.14 |
37.02 - 38.02 |
1.1139 times |
Fri 26 September 2025 |
37.07 (-0.24%) |
37.24 |
36.59 - 37.44 |
1.2414 times |
Fri 19 September 2025 |
37.16 (-0.43%) |
37.50 |
37.06 - 37.69 |
1.1956 times |
Fri 12 September 2025 |
37.32 (1.28%) |
37.05 |
36.96 - 37.52 |
0.8366 times |
Fri 05 September 2025 |
36.85 (0.35%) |
36.26 |
36.15 - 37.05 |
1.2313 times |
Fri 29 August 2025 |
36.72 (0%) |
36.75 |
36.69 - 36.80 |
0.1563 times |
Fri 29 August 2025 |
36.72 (-1.77%) |
37.33 |
36.51 - 37.33 |
1.5449 times |
Fri 22 August 2025 |
37.38 (0.92%) |
36.92 |
36.82 - 37.49 |
0.7927 times |
Monthly price and charts AdvisorsharesAthena Strong monthly Stock price targets for AdvisorsharesAthena DIVI are 37.38 and 38.74 | Monthly Target 1 | 36.26 | | Monthly Target 2 | 37.14 | | Monthly Target 3 | 37.623333333333 | | Monthly Target 4 | 38.5 | | Monthly Target 5 | 38.98 |
Monthly price and volumes Advisorshares Athena
| Date |
Closing |
Open |
Range |
Volume |
Fri 24 October 2025 |
38.01 (1.88%) |
37.49 |
36.75 - 38.11 |
0.5923 times |
Tue 30 September 2025 |
37.31 (1.61%) |
36.26 |
36.15 - 37.69 |
0.9329 times |
Fri 29 August 2025 |
36.72 (4.7%) |
35.03 |
34.72 - 37.49 |
0.8286 times |
Thu 31 July 2025 |
35.07 (-1.6%) |
35.58 |
34.96 - 36.62 |
0.9632 times |
Mon 30 June 2025 |
35.64 (0.85%) |
35.33 |
34.03 - 36.05 |
0.9722 times |
Fri 30 May 2025 |
35.34 (4.53%) |
33.95 |
33.61 - 35.50 |
1.0873 times |
Wed 30 April 2025 |
33.81 (3.74%) |
32.59 |
28.70 - 33.98 |
1.0501 times |
Mon 31 March 2025 |
32.59 (0.8%) |
32.98 |
32.23 - 34.01 |
1.2444 times |
Fri 28 February 2025 |
32.33 (2.7%) |
30.93 |
30.80 - 33.00 |
1.299 times |
Fri 31 January 2025 |
31.48 (4.9%) |
30.02 |
29.58 - 31.93 |
1.03 times |
Tue 31 December 2024 |
30.01 (-1.7%) |
31.42 |
29.51 - 31.80 |
0.8021 times |

DMA SMA EMA moving averages of Advisorshares Athena DIVI
DMA (daily moving average) of Advisorshares Athena DIVI
| DMA period | DMA value | | 5 day DMA | 37.91 | | 12 day DMA | 37.59 | | 20 day DMA | 37.62 | | 35 day DMA | 37.46 | | 50 day DMA | 37.28 | | 100 day DMA | 36.46 | | 150 day DMA | 35.39 | | 200 day DMA | 34.58 | EMA (exponential moving average) of Advisorshares Athena DIVI
| EMA period | EMA current | EMA prev | EMA prev2 | | 5 day EMA | 37.88 | 37.82 | 37.75 | | 12 day EMA | 37.72 | 37.67 | 37.62 | | 20 day EMA | 37.61 | 37.57 | 37.53 | | 35 day EMA | 37.44 | 37.41 | 37.38 | | 50 day EMA | 37.29 | 37.26 | 37.23 |
SMA (simple moving average) of Advisorshares Athena DIVI
| SMA period | SMA current | SMA prev | SMA prev2 | | 5 day SMA | 37.91 | 37.86 | 37.8 | | 12 day SMA | 37.59 | 37.57 | 37.55 | | 20 day SMA | 37.62 | 37.57 | 37.51 | | 35 day SMA | 37.46 | 37.43 | 37.39 | | 50 day SMA | 37.28 | 37.26 | 37.24 | | 100 day SMA | 36.46 | 36.44 | 36.41 | | 150 day SMA | 35.39 | 35.36 | 35.33 | | 200 day SMA | 34.58 | 34.54 | 34.5 |
|
|
