AmconDistributing DIT full analysis,charts,indicators,moving averages,SMA,DMA,EMA,ADX,MACD,RSIAmcon Distributing DIT WideScreen charts, DMA,SMA,EMA technical analysis, forecast prediction, by indicators ADX,MACD,RSI,CCI AMEX stock exchange
Daily price and charts and targets AmconDistributing Strong Daily Stock price targets for AmconDistributing DIT are 115.48 and 117.53 | Daily Target 1 | 113.77 | | Daily Target 2 | 115.14 | | Daily Target 3 | 115.82333333333 | | Daily Target 4 | 117.19 | | Daily Target 5 | 117.87 |
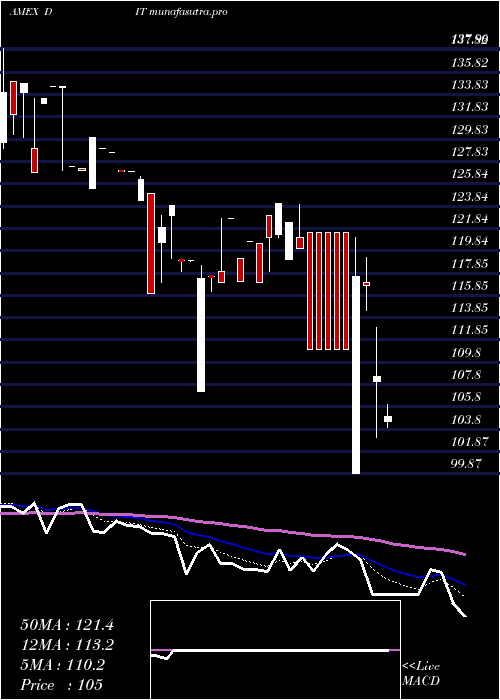
Daily price and volume Amcon Distributing
| Date |
Closing |
Open |
Range |
Volume |
Fri 24 October 2025 |
116.50 (-0.01%) |
114.46 |
114.46 - 116.51 |
0.1755 times |
Thu 23 October 2025 |
116.51 (-0.41%) |
116.94 |
116.51 - 116.94 |
0.1199 times |
Wed 22 October 2025 |
116.99 (-2.02%) |
118.01 |
116.99 - 118.01 |
0.2697 times |
Tue 21 October 2025 |
119.40 (1.16%) |
119.00 |
115.02 - 119.40 |
0.8562 times |
Mon 20 October 2025 |
118.03 (-0.56%) |
119.01 |
116.20 - 119.01 |
1.5839 times |
Fri 17 October 2025 |
118.70 (-0.29%) |
117.52 |
116.76 - 118.70 |
2.1575 times |
Thu 16 October 2025 |
119.04 (0.89%) |
116.04 |
116.04 - 119.04 |
0.1284 times |
Wed 15 October 2025 |
117.99 (-0.01%) |
118.00 |
117.99 - 118.00 |
0.4281 times |
Tue 14 October 2025 |
118.00 (3.06%) |
120.50 |
115.01 - 120.50 |
0.4281 times |
Mon 13 October 2025 |
114.50 (1.85%) |
112.70 |
112.70 - 118.00 |
3.8527 times |
Fri 10 October 2025 |
112.42 (-2.24%) |
112.42 |
112.42 - 112.42 |
0.4281 times |
Weekly price and charts AmconDistributing Strong weekly Stock price targets for AmconDistributing DIT are 113.01 and 117.95 | Weekly Target 1 | 111.85 | | Weekly Target 2 | 114.17 | | Weekly Target 3 | 116.78666666667 | | Weekly Target 4 | 119.11 | | Weekly Target 5 | 121.73 |
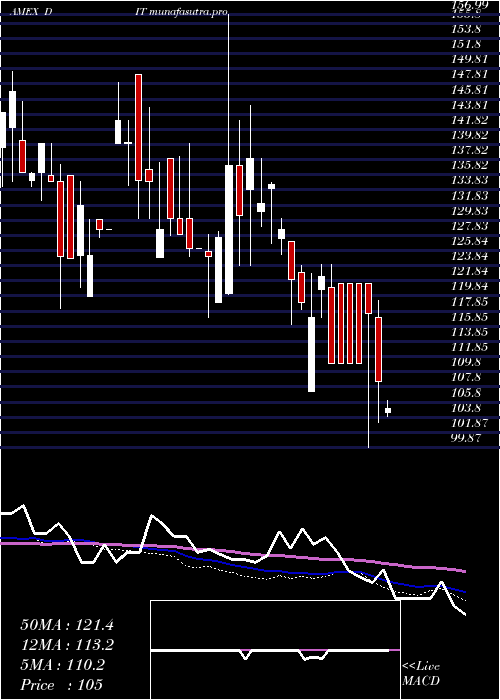
Weekly price and volumes for Amcon Distributing
| Date |
Closing |
Open |
Range |
Volume |
Fri 24 October 2025 |
116.50 (-1.85%) |
119.01 |
114.46 - 119.40 |
0.474 times |
Fri 17 October 2025 |
118.70 (5.59%) |
112.70 |
112.70 - 120.50 |
1.1033 times |
Fri 10 October 2025 |
112.42 (-5.54%) |
116.80 |
112.42 - 119.68 |
0.6793 times |
Fri 03 October 2025 |
119.01 (2.15%) |
116.54 |
113.47 - 119.50 |
1.1263 times |
Fri 26 September 2025 |
116.50 (-0.85%) |
118.50 |
102.19 - 118.50 |
1.8231 times |
Fri 19 September 2025 |
117.50 (-2.47%) |
116.71 |
111.38 - 119.30 |
1.6205 times |
Fri 12 September 2025 |
120.47 (4.77%) |
114.00 |
113.50 - 121.00 |
0.6752 times |
Fri 05 September 2025 |
114.99 (-4.17%) |
121.00 |
111.16 - 121.00 |
1.688 times |
Fri 29 August 2025 |
119.99 (0%) |
118.50 |
118.50 - 120.98 |
0.135 times |
Fri 29 August 2025 |
119.99 (1.57%) |
114.51 |
114.00 - 120.98 |
0.6752 times |
Fri 22 August 2025 |
118.13 (8%) |
104.69 |
104.69 - 120.00 |
2.0257 times |
Monthly price and charts AmconDistributing Strong monthly Stock price targets for AmconDistributing DIT are 110.42 and 118.5 | Monthly Target 1 | 108.39 | | Monthly Target 2 | 112.45 | | Monthly Target 3 | 116.47333333333 | | Monthly Target 4 | 120.53 | | Monthly Target 5 | 124.55 |
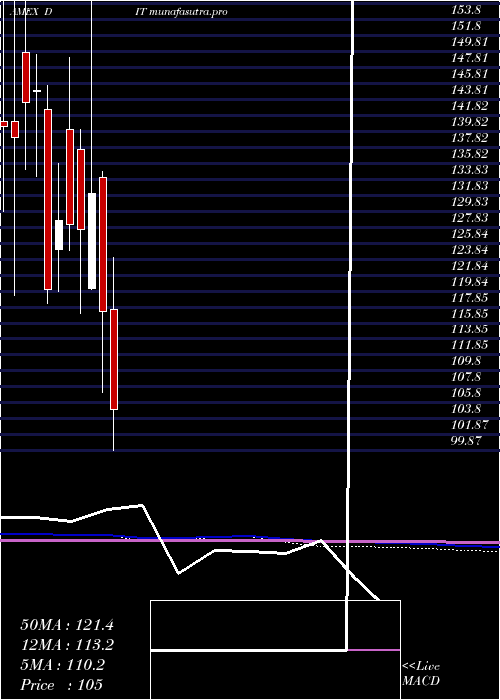
Monthly price and volumes Amcon Distributing
| Date |
Closing |
Open |
Range |
Volume |
Fri 24 October 2025 |
116.50 (2.41%) |
119.50 |
112.42 - 120.50 |
0.5977 times |
Tue 30 September 2025 |
113.76 (-5.19%) |
121.00 |
102.19 - 121.00 |
1.595 times |
Fri 29 August 2025 |
119.99 (9.09%) |
109.02 |
104.00 - 120.98 |
0.87 times |
Thu 31 July 2025 |
109.99 (-0.1%) |
113.88 |
105.00 - 126.50 |
1.5897 times |
Mon 30 June 2025 |
110.10 (-2.41%) |
108.13 |
94.92 - 115.00 |
1.2084 times |
Wed 28 May 2025 |
112.82 (-6.2%) |
120.00 |
109.99 - 120.04 |
0.3867 times |
Wed 30 April 2025 |
120.28 (2.53%) |
117.50 |
99.87 - 124.03 |
0.792 times |
Mon 31 March 2025 |
117.31 (-11.12%) |
133.99 |
107.21 - 134.80 |
0.7097 times |
Fri 28 February 2025 |
131.99 (3.52%) |
120.17 |
120.00 - 156.99 |
1.5467 times |
Fri 31 January 2025 |
127.50 (-0.51%) |
137.50 |
117.00 - 140.00 |
0.7041 times |
Tue 31 December 2024 |
128.16 (-0.37%) |
140.00 |
124.97 - 149.00 |
0.9364 times |
DMA SMA EMA moving averages of Amcon Distributing DIT
DMA (daily moving average) of Amcon Distributing DIT
| DMA period | DMA value | | 5 day DMA | 117.49 | | 12 day DMA | 116.92 | | 20 day DMA | 116.62 | | 35 day DMA | 116.58 | | 50 day DMA | 115.98 | | 100 day DMA | 113.5 | | 150 day DMA | 116.17 | | 200 day DMA | 120.01 | EMA (exponential moving average) of Amcon Distributing DIT
| EMA period | EMA current | EMA prev | EMA prev2 | | 5 day EMA | 117.14 | 117.46 | 117.93 | | 12 day EMA | 117.14 | 117.26 | 117.4 | | 20 day EMA | 116.85 | 116.89 | 116.93 | | 35 day EMA | 116.15 | 116.13 | 116.11 | | 50 day EMA | 115.55 | 115.51 | 115.47 |
SMA (simple moving average) of Amcon Distributing DIT
| SMA period | SMA current | SMA prev | SMA prev2 | | 5 day SMA | 117.49 | 117.93 | 118.43 | | 12 day SMA | 116.92 | 116.88 | 116.93 | | 20 day SMA | 116.62 | 116.62 | 116.65 | | 35 day SMA | 116.58 | 116.59 | 116.44 | | 50 day SMA | 115.98 | 115.79 | 115.66 | | 100 day SMA | 113.5 | 113.53 | 113.53 | | 150 day SMA | 116.17 | 116.26 | 116.41 | | 200 day SMA | 120.01 | 120.07 | 120.13 |
|
|
