IntlMidcap DIM full analysis,charts,indicators,moving averages,SMA,DMA,EMA,ADX,MACD,RSIIntl Midcap DIM WideScreen charts, DMA,SMA,EMA technical analysis, forecast prediction, by indicators ADX,MACD,RSI,CCI AMEX stock exchange
Daily price and charts and targets IntlMidcap Strong Daily Stock price targets for IntlMidcap DIM are 77.38 and 78.08 | Daily Target 1 | 76.8 | | Daily Target 2 | 77.26 | | Daily Target 3 | 77.503333333333 | | Daily Target 4 | 77.96 | | Daily Target 5 | 78.2 |
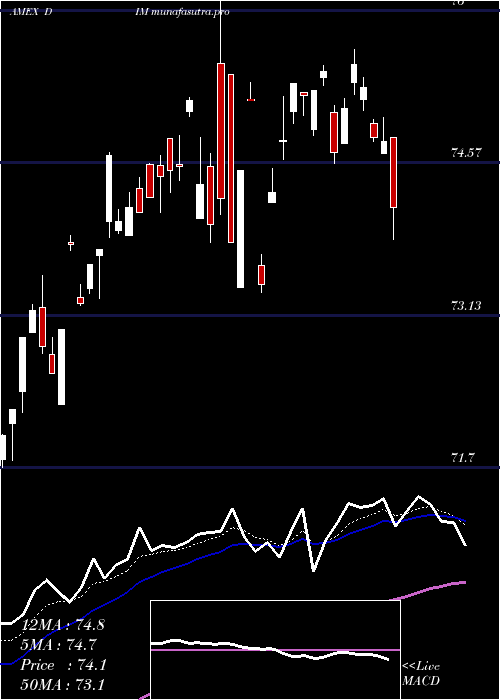
Daily price and volume Intl Midcap
| Date |
Closing |
Open |
Range |
Volume |
Thu 23 October 2025 |
77.71 (1.12%) |
77.28 |
77.05 - 77.75 |
1.223 times |
Wed 22 October 2025 |
76.85 (0.21%) |
76.89 |
76.85 - 76.89 |
0.1783 times |
Tue 21 October 2025 |
76.69 (-0.78%) |
76.82 |
76.60 - 77.00 |
0.4391 times |
Mon 20 October 2025 |
77.29 (0.72%) |
77.03 |
77.03 - 77.43 |
1.8202 times |
Fri 17 October 2025 |
76.74 (-0.07%) |
76.43 |
76.41 - 76.74 |
0.5591 times |
Thu 16 October 2025 |
76.79 (0.26%) |
76.59 |
76.58 - 77.05 |
0.4056 times |
Wed 15 October 2025 |
76.59 (-0.13%) |
76.64 |
76.44 - 76.86 |
3.1616 times |
Tue 14 October 2025 |
76.69 (0.6%) |
75.79 |
75.79 - 76.72 |
1.3173 times |
Mon 13 October 2025 |
76.23 (0.71%) |
75.97 |
75.97 - 76.24 |
0.3864 times |
Fri 10 October 2025 |
75.69 (-1.59%) |
76.72 |
75.69 - 76.72 |
0.5094 times |
Thu 09 October 2025 |
76.91 (-0.47%) |
77.49 |
76.69 - 77.49 |
0.5269 times |
Weekly price and charts IntlMidcap Strong weekly Stock price targets for IntlMidcap DIM are 77.16 and 78.31 | Weekly Target 1 | 76.2 | | Weekly Target 2 | 76.96 | | Weekly Target 3 | 77.353333333333 | | Weekly Target 4 | 78.11 | | Weekly Target 5 | 78.5 |
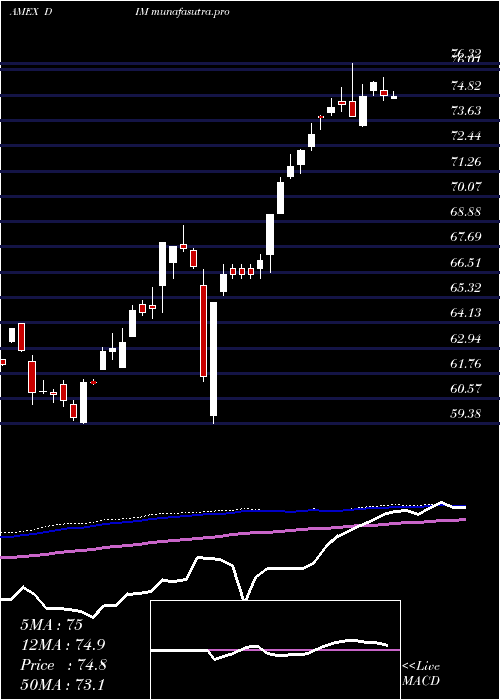
Weekly price and volumes for Intl Midcap
| Date |
Closing |
Open |
Range |
Volume |
Thu 23 October 2025 |
77.71 (1.26%) |
77.03 |
76.60 - 77.75 |
0.9759 times |
Fri 17 October 2025 |
76.74 (1.39%) |
75.97 |
75.79 - 77.05 |
1.5543 times |
Fri 10 October 2025 |
75.69 (-2.97%) |
77.91 |
75.69 - 78.03 |
0.7432 times |
Fri 03 October 2025 |
78.01 (1.73%) |
76.96 |
76.83 - 78.05 |
1.2477 times |
Fri 26 September 2025 |
76.68 (-1.29%) |
77.53 |
75.91 - 78.08 |
0.8195 times |
Fri 19 September 2025 |
77.68 (-0.92%) |
78.90 |
77.44 - 78.96 |
1.0396 times |
Fri 12 September 2025 |
78.40 (1.61%) |
77.73 |
77.60 - 78.69 |
1.1941 times |
Fri 05 September 2025 |
77.16 (0%) |
75.75 |
75.75 - 77.54 |
1.2737 times |
Fri 29 August 2025 |
77.16 (0%) |
77.06 |
77.06 - 77.25 |
0.206 times |
Fri 29 August 2025 |
77.16 (-1.94%) |
78.32 |
76.81 - 78.39 |
0.9459 times |
Fri 22 August 2025 |
78.69 (1.29%) |
77.42 |
77.28 - 78.79 |
0.885 times |
Monthly price and charts IntlMidcap Strong monthly Stock price targets for IntlMidcap DIM are 76.7 and 79.06 | Monthly Target 1 | 74.79 | | Monthly Target 2 | 76.25 | | Monthly Target 3 | 77.15 | | Monthly Target 4 | 78.61 | | Monthly Target 5 | 79.51 |
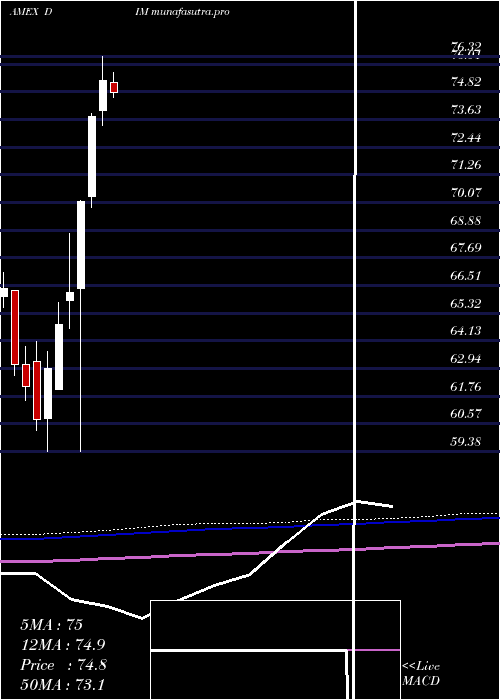
Monthly price and volumes Intl Midcap
| Date |
Closing |
Open |
Range |
Volume |
Thu 23 October 2025 |
77.71 (0.54%) |
77.52 |
75.69 - 78.05 |
0.7006 times |
Tue 30 September 2025 |
77.29 (0.17%) |
75.75 |
75.75 - 78.96 |
0.8991 times |
Fri 29 August 2025 |
77.16 (3.84%) |
74.56 |
74.07 - 78.79 |
0.8559 times |
Thu 31 July 2025 |
74.31 (-1.33%) |
75.23 |
73.85 - 79.73 |
1.3991 times |
Mon 30 June 2025 |
75.31 (2.12%) |
74.02 |
73.35 - 76.32 |
1.4849 times |
Fri 30 May 2025 |
73.75 (5.16%) |
70.34 |
69.87 - 73.88 |
0.9397 times |
Wed 30 April 2025 |
70.13 (5.95%) |
66.38 |
59.38 - 70.16 |
1.079 times |
Mon 31 March 2025 |
66.19 (2.13%) |
65.86 |
64.64 - 68.72 |
0.9017 times |
Fri 28 February 2025 |
64.81 (2.99%) |
62.03 |
62.03 - 65.79 |
0.7086 times |
Fri 31 January 2025 |
62.93 (3.61%) |
60.78 |
59.38 - 63.65 |
1.0314 times |
Tue 31 December 2024 |
60.74 (-2.3%) |
63.25 |
60.28 - 64.10 |
1.2546 times |
DMA SMA EMA moving averages of Intl Midcap DIM
DMA (daily moving average) of Intl Midcap DIM
| DMA period | DMA value | | 5 day DMA | 77.06 | | 12 day DMA | 76.79 | | 20 day DMA | 77.04 | | 35 day DMA | 77.41 | | 50 day DMA | 77.4 | | 100 day DMA | 76.26 | | 150 day DMA | 73.75 | | 200 day DMA | 71.36 | EMA (exponential moving average) of Intl Midcap DIM
| EMA period | EMA current | EMA prev | EMA prev2 | | 5 day EMA | 77.12 | 76.83 | 76.82 | | 12 day EMA | 77.01 | 76.88 | 76.88 | | 20 day EMA | 77.07 | 77 | 77.02 | | 35 day EMA | 77.17 | 77.14 | 77.16 | | 50 day EMA | 77.34 | 77.32 | 77.34 |
SMA (simple moving average) of Intl Midcap DIM
| SMA period | SMA current | SMA prev | SMA prev2 | | 5 day SMA | 77.06 | 76.87 | 76.82 | | 12 day SMA | 76.79 | 76.75 | 76.85 | | 20 day SMA | 77.04 | 76.96 | 76.98 | | 35 day SMA | 77.41 | 77.39 | 77.37 | | 50 day SMA | 77.4 | 77.4 | 77.41 | | 100 day SMA | 76.26 | 76.22 | 76.18 | | 150 day SMA | 73.75 | 73.68 | 73.63 | | 200 day SMA | 71.36 | 71.28 | 71.2 |
|
|
