EquityIncome DHS full analysis,charts,indicators,moving averages,SMA,DMA,EMA,ADX,MACD,RSIEquity Income DHS WideScreen charts, DMA,SMA,EMA technical analysis, forecast prediction, by indicators ADX,MACD,RSI,CCI AMEX stock exchange
Daily price and charts and targets EquityIncome Strong Daily Stock price targets for EquityIncome DHS are 100.06 and 100.66 | Daily Target 1 | 99.91 | | Daily Target 2 | 100.2 | | Daily Target 3 | 100.51 | | Daily Target 4 | 100.8 | | Daily Target 5 | 101.11 |
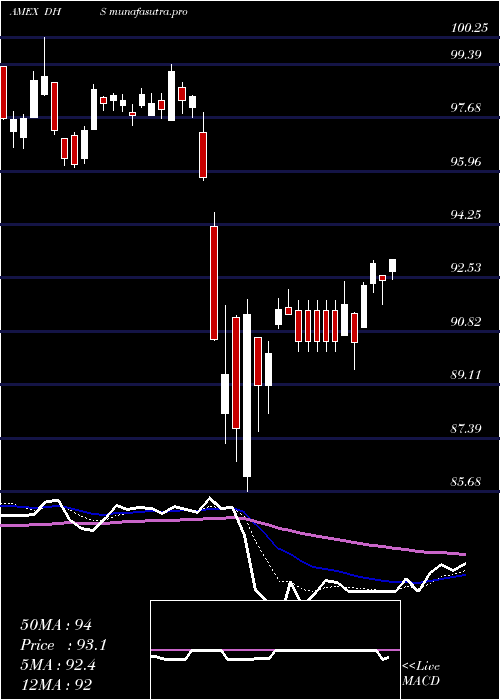
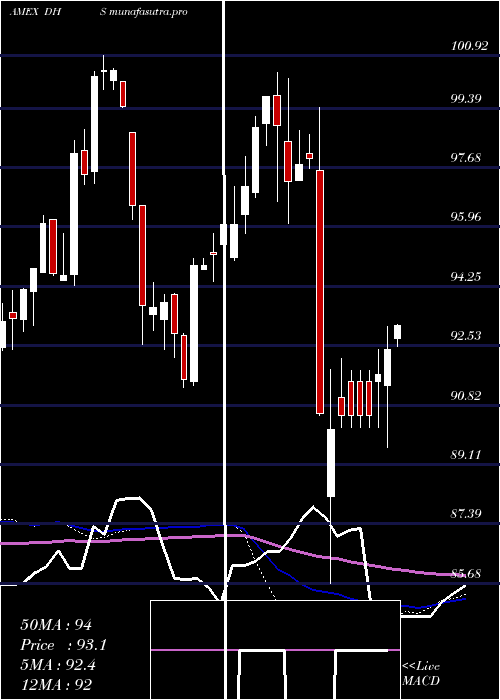
Daily price and volume Equity Income
| Date |
Closing |
Open |
Range |
Volume |
Thu 23 October 2025 |
100.49 (-0.32%) |
100.82 |
100.22 - 100.82 |
0.3613 times |
Wed 22 October 2025 |
100.81 (0.27%) |
100.37 |
100.37 - 101.19 |
1.2684 times |
Tue 21 October 2025 |
100.54 (-0.34%) |
100.87 |
100.08 - 100.87 |
1.3253 times |
Mon 20 October 2025 |
100.88 (0.72%) |
99.76 |
99.76 - 100.88 |
1.5576 times |
Fri 17 October 2025 |
100.16 (1.01%) |
99.55 |
99.55 - 100.19 |
0.6825 times |
Thu 16 October 2025 |
99.16 (-1.28%) |
100.70 |
99.06 - 100.70 |
0.3521 times |
Wed 15 October 2025 |
100.45 (-0.11%) |
100.70 |
99.94 - 101.13 |
0.8986 times |
Tue 14 October 2025 |
100.56 (0.89%) |
99.24 |
99.24 - 100.64 |
0.8986 times |
Mon 13 October 2025 |
99.67 (0.47%) |
99.33 |
99.11 - 99.78 |
1.4759 times |
Fri 10 October 2025 |
99.20 (-0.98%) |
100.45 |
99.20 - 100.68 |
1.1797 times |
Thu 09 October 2025 |
100.18 (-0.2%) |
100.47 |
100.09 - 100.61 |
0.8133 times |
Weekly price and charts EquityIncome Strong weekly Stock price targets for EquityIncome DHS are 100.13 and 101.56 | Weekly Target 1 | 99.05 | | Weekly Target 2 | 99.77 | | Weekly Target 3 | 100.48 | | Weekly Target 4 | 101.2 | | Weekly Target 5 | 101.91 |
Weekly price and volumes for Equity Income
| Date |
Closing |
Open |
Range |
Volume |
Thu 23 October 2025 |
100.49 (0.33%) |
99.76 |
99.76 - 101.19 |
0.8425 times |
Fri 17 October 2025 |
100.16 (0.97%) |
99.33 |
99.06 - 101.13 |
0.8042 times |
Fri 10 October 2025 |
99.20 (-1.68%) |
100.99 |
99.20 - 100.99 |
0.8656 times |
Fri 03 October 2025 |
100.90 (0.31%) |
100.72 |
99.77 - 101.29 |
1.5105 times |
Fri 26 September 2025 |
100.59 (0.11%) |
100.29 |
99.62 - 100.93 |
1.403 times |
Fri 19 September 2025 |
100.48 (-0.38%) |
101.02 |
99.94 - 101.35 |
1.0693 times |
Fri 12 September 2025 |
100.86 (0.29%) |
100.48 |
99.67 - 101.56 |
0.985 times |
Fri 05 September 2025 |
100.57 (-0.69%) |
101.00 |
100.00 - 101.06 |
1.0778 times |
Fri 29 August 2025 |
101.27 (0%) |
100.74 |
100.74 - 101.27 |
0.2399 times |
Fri 29 August 2025 |
101.27 (-0.54%) |
101.59 |
100.32 - 101.67 |
1.2024 times |
Fri 22 August 2025 |
101.82 (2.2%) |
99.52 |
99.37 - 101.91 |
0.9831 times |
Monthly price and charts EquityIncome Strong monthly Stock price targets for EquityIncome DHS are 98.66 and 100.89 | Monthly Target 1 | 98.05 | | Monthly Target 2 | 99.27 | | Monthly Target 3 | 100.28 | | Monthly Target 4 | 101.5 | | Monthly Target 5 | 102.51 |
Monthly price and volumes Equity Income
| Date |
Closing |
Open |
Range |
Volume |
Thu 23 October 2025 |
100.49 (-0.26%) |
100.54 |
99.06 - 101.29 |
0.5736 times |
Tue 30 September 2025 |
100.75 (-0.51%) |
101.00 |
99.62 - 101.56 |
0.7913 times |
Fri 29 August 2025 |
101.27 (4.75%) |
96.59 |
96.08 - 101.91 |
0.6852 times |
Thu 31 July 2025 |
96.68 (0.73%) |
96.08 |
96.08 - 99.24 |
0.7959 times |
Mon 30 June 2025 |
95.98 (1.47%) |
94.59 |
93.69 - 96.43 |
0.7981 times |
Fri 30 May 2025 |
94.59 (1.27%) |
93.22 |
92.56 - 95.72 |
1.1615 times |
Wed 30 April 2025 |
93.40 (-5.81%) |
98.64 |
85.68 - 98.82 |
1.959 times |
Mon 31 March 2025 |
99.16 (-0.58%) |
99.75 |
96.07 - 100.42 |
1.2137 times |
Fri 28 February 2025 |
99.74 (3.87%) |
95.08 |
95.00 - 99.74 |
1.0822 times |
Fri 31 January 2025 |
96.02 (2.85%) |
93.82 |
91.32 - 96.97 |
0.9394 times |
Tue 31 December 2024 |
93.36 (-7.09%) |
100.16 |
92.42 - 100.16 |
0.7727 times |

DMA SMA EMA moving averages of Equity Income DHS
DMA (daily moving average) of Equity Income DHS
| DMA period | DMA value | | 5 day DMA | 100.58 | | 12 day DMA | 100.21 | | 20 day DMA | 100.39 | | 35 day DMA | 100.42 | | 50 day DMA | 100.5 | | 100 day DMA | 98.75 | | 150 day DMA | 96.98 | | 200 day DMA | 96.9 | EMA (exponential moving average) of Equity Income DHS
| EMA period | EMA current | EMA prev | EMA prev2 | | 5 day EMA | 100.5 | 100.51 | 100.36 | | 12 day EMA | 100.39 | 100.37 | 100.29 | | 20 day EMA | 100.36 | 100.35 | 100.3 | | 35 day EMA | 100.35 | 100.34 | 100.31 | | 50 day EMA | 100.38 | 100.38 | 100.36 |
SMA (simple moving average) of Equity Income DHS
| SMA period | SMA current | SMA prev | SMA prev2 | | 5 day SMA | 100.58 | 100.31 | 100.24 | | 12 day SMA | 100.21 | 100.23 | 100.21 | | 20 day SMA | 100.39 | 100.36 | 100.34 | | 35 day SMA | 100.42 | 100.43 | 100.42 | | 50 day SMA | 100.5 | 100.48 | 100.47 | | 100 day SMA | 98.75 | 98.7 | 98.63 | | 150 day SMA | 96.98 | 96.96 | 96.94 | | 200 day SMA | 96.9 | 96.86 | 96.83 |
|
|
