DividendGrowth DGRO full analysis,charts,indicators,moving averages,SMA,DMA,EMA,ADX,MACD,RSIDividend Growth DGRO WideScreen charts, DMA,SMA,EMA technical analysis, forecast prediction, by indicators ADX,MACD,RSI,CCI AMEX stock exchange
Daily price and charts and targets DividendGrowth Strong Daily Stock price targets for DividendGrowth DGRO are 68.26 and 68.61 | Daily Target 1 | 68.03 | | Daily Target 2 | 68.23 | | Daily Target 3 | 68.38 | | Daily Target 4 | 68.58 | | Daily Target 5 | 68.73 |
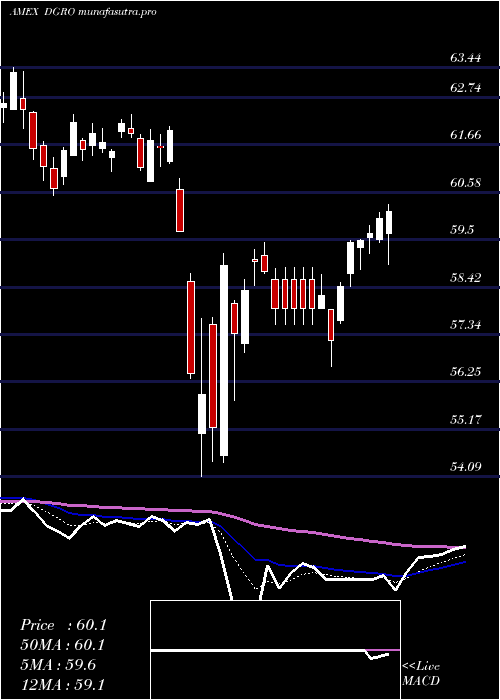
Daily price and volume Dividend Growth
| Date |
Closing |
Open |
Range |
Volume |
Thu 23 October 2025 |
68.43 (0.22%) |
68.43 |
68.18 - 68.53 |
0.9036 times |
Wed 22 October 2025 |
68.28 (-0.35%) |
68.56 |
68.13 - 68.61 |
0.9667 times |
Tue 21 October 2025 |
68.52 (0.06%) |
68.51 |
68.42 - 68.81 |
0.916 times |
Mon 20 October 2025 |
68.48 (0.88%) |
68.03 |
68.00 - 68.56 |
0.5493 times |
Fri 17 October 2025 |
67.88 (0.53%) |
67.33 |
67.33 - 67.99 |
0.7764 times |
Thu 16 October 2025 |
67.52 (-0.94%) |
68.49 |
67.34 - 68.49 |
0.8543 times |
Wed 15 October 2025 |
68.16 (0.13%) |
68.34 |
67.70 - 68.74 |
1.6705 times |
Tue 14 October 2025 |
68.07 (0.7%) |
67.19 |
67.10 - 68.27 |
0.9996 times |
Mon 13 October 2025 |
67.60 (1%) |
67.40 |
67.32 - 67.79 |
0.6805 times |
Fri 10 October 2025 |
66.93 (-1.78%) |
68.32 |
66.92 - 68.44 |
1.6832 times |
Thu 09 October 2025 |
68.14 (-0.53%) |
68.64 |
68.04 - 68.66 |
0.8156 times |
Weekly price and charts DividendGrowth Strong weekly Stock price targets for DividendGrowth DGRO are 68.22 and 69.03 | Weekly Target 1 | 67.6 | | Weekly Target 2 | 68.02 | | Weekly Target 3 | 68.413333333333 | | Weekly Target 4 | 68.83 | | Weekly Target 5 | 69.22 |
Weekly price and volumes for Dividend Growth
| Date |
Closing |
Open |
Range |
Volume |
Thu 23 October 2025 |
68.43 (0.81%) |
68.03 |
68.00 - 68.81 |
0.7704 times |
Fri 17 October 2025 |
67.88 (1.42%) |
67.40 |
67.10 - 68.74 |
1.1504 times |
Fri 10 October 2025 |
66.93 (-2.41%) |
68.61 |
66.92 - 68.93 |
1.0895 times |
Fri 03 October 2025 |
68.58 (1.23%) |
67.93 |
67.50 - 68.88 |
0.9913 times |
Fri 26 September 2025 |
67.75 (0.28%) |
67.39 |
67.07 - 68.01 |
0.9103 times |
Fri 19 September 2025 |
67.56 (-0.19%) |
67.83 |
67.01 - 67.87 |
1.3272 times |
Fri 12 September 2025 |
67.69 (1.09%) |
67.00 |
66.62 - 68.09 |
0.9448 times |
Fri 05 September 2025 |
66.96 (0.04%) |
66.54 |
66.19 - 67.50 |
1.3052 times |
Fri 29 August 2025 |
66.93 (0%) |
66.89 |
66.71 - 67.04 |
0.3607 times |
Fri 29 August 2025 |
66.93 (-0.16%) |
66.96 |
66.46 - 67.04 |
1.1504 times |
Fri 22 August 2025 |
67.04 (1.41%) |
66.09 |
65.98 - 67.20 |
1.0627 times |

Monthly price and charts DividendGrowth Strong monthly Stock price targets for DividendGrowth DGRO are 67.68 and 69.69 | Monthly Target 1 | 66.08 | | Monthly Target 2 | 67.26 | | Monthly Target 3 | 68.093333333333 | | Monthly Target 4 | 69.27 | | Monthly Target 5 | 70.1 |
Monthly price and volumes Dividend Growth
| Date |
Closing |
Open |
Range |
Volume |
Thu 23 October 2025 |
68.43 (0.51%) |
67.94 |
66.92 - 68.93 |
0.7742 times |
Tue 30 September 2025 |
68.08 (1.72%) |
66.54 |
66.19 - 68.13 |
1.0912 times |
Fri 29 August 2025 |
66.93 (3.54%) |
64.36 |
63.76 - 67.20 |
1.0449 times |
Thu 31 July 2025 |
64.64 (1.09%) |
63.91 |
63.85 - 65.84 |
0.8303 times |
Mon 30 June 2025 |
63.94 (2.95%) |
61.97 |
61.56 - 64.05 |
0.8247 times |
Fri 30 May 2025 |
62.11 (3.28%) |
60.08 |
59.80 - 62.86 |
0.8501 times |
Wed 30 April 2025 |
60.14 (-2.65%) |
61.63 |
54.09 - 62.08 |
1.6343 times |
Mon 31 March 2025 |
61.78 (-3.65%) |
64.28 |
60.51 - 64.48 |
0.9986 times |
Fri 28 February 2025 |
64.12 (1.02%) |
62.73 |
62.53 - 64.43 |
0.7901 times |
Fri 31 January 2025 |
63.47 (3.47%) |
61.64 |
60.30 - 64.03 |
1.1616 times |
Tue 31 December 2024 |
61.34 (-5.27%) |
64.81 |
60.57 - 64.86 |
1.0353 times |

DMA SMA EMA moving averages of Dividend Growth DGRO
DMA (daily moving average) of Dividend Growth DGRO
| DMA period | DMA value | | 5 day DMA | 68.32 | | 12 day DMA | 68.04 | | 20 day DMA | 68.11 | | 35 day DMA | 67.81 | | 50 day DMA | 67.45 | | 100 day DMA | 65.85 | | 150 day DMA | 63.93 | | 200 day DMA | 63.67 | EMA (exponential moving average) of Dividend Growth DGRO
| EMA period | EMA current | EMA prev | EMA prev2 | | 5 day EMA | 68.3 | 68.23 | 68.21 | | 12 day EMA | 68.15 | 68.1 | 68.07 | | 20 day EMA | 68.02 | 67.98 | 67.95 | | 35 day EMA | 67.71 | 67.67 | 67.63 | | 50 day EMA | 67.4 | 67.36 | 67.32 |
SMA (simple moving average) of Dividend Growth DGRO
| SMA period | SMA current | SMA prev | SMA prev2 | | 5 day SMA | 68.32 | 68.14 | 68.11 | | 12 day SMA | 68.04 | 68.05 | 68.07 | | 20 day SMA | 68.11 | 68.05 | 68.02 | | 35 day SMA | 67.81 | 67.77 | 67.72 | | 50 day SMA | 67.45 | 67.41 | 67.37 | | 100 day SMA | 65.85 | 65.79 | 65.72 | | 150 day SMA | 63.93 | 63.89 | 63.84 | | 200 day SMA | 63.67 | 63.64 | 63.6 |
|
|
