JapanSmallcap DFJ full analysis,charts,indicators,moving averages,SMA,DMA,EMA,ADX,MACD,RSIJapan Smallcap DFJ WideScreen charts, DMA,SMA,EMA technical analysis, forecast prediction, by indicators ADX,MACD,RSI,CCI AMEX stock exchange
Daily price and charts and targets JapanSmallcap Strong Daily Stock price targets for JapanSmallcap DFJ are 93.3 and 93.52 | Daily Target 1 | 93.26 | | Daily Target 2 | 93.34 | | Daily Target 3 | 93.476666666667 | | Daily Target 4 | 93.56 | | Daily Target 5 | 93.7 |
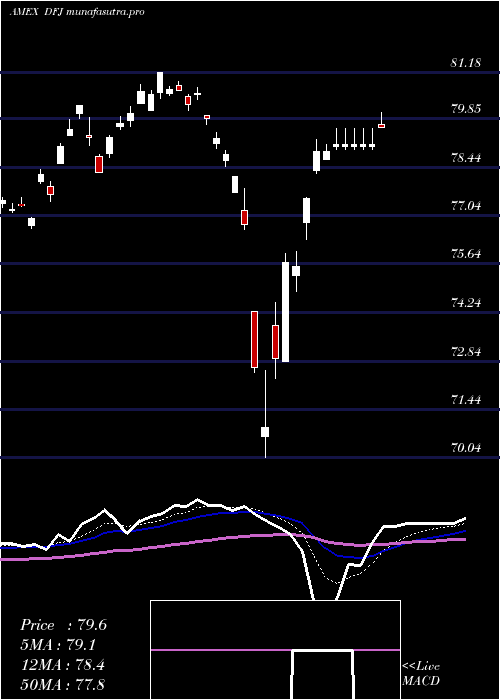
Daily price and volume Japan Smallcap
| Date |
Closing |
Open |
Range |
Volume |
Thu 23 October 2025 |
93.43 (0.49%) |
93.47 |
93.39 - 93.61 |
0.5714 times |
Wed 22 October 2025 |
92.97 (0.54%) |
93.09 |
92.81 - 93.09 |
0.4115 times |
Tue 21 October 2025 |
92.47 (-1.3%) |
92.57 |
92.34 - 92.76 |
1.2699 times |
Mon 20 October 2025 |
93.69 (0.89%) |
93.53 |
93.53 - 93.87 |
0.7437 times |
Fri 17 October 2025 |
92.86 (0.52%) |
92.78 |
92.74 - 92.89 |
0.3912 times |
Thu 16 October 2025 |
92.38 (0.13%) |
92.27 |
92.23 - 92.53 |
0.5135 times |
Wed 15 October 2025 |
92.26 (1.37%) |
92.16 |
92.13 - 92.32 |
0.3843 times |
Tue 14 October 2025 |
91.01 (0.94%) |
90.16 |
90.16 - 91.04 |
0.9691 times |
Mon 13 October 2025 |
90.16 (0.13%) |
90.21 |
89.97 - 90.31 |
1.6709 times |
Fri 10 October 2025 |
90.04 (-2.42%) |
90.42 |
89.61 - 90.70 |
3.0745 times |
Thu 09 October 2025 |
92.27 (-0.36%) |
92.84 |
92.19 - 92.84 |
0.5514 times |
Weekly price and charts JapanSmallcap Strong weekly Stock price targets for JapanSmallcap DFJ are 92.12 and 93.65 | Weekly Target 1 | 91.68 | | Weekly Target 2 | 92.56 | | Weekly Target 3 | 93.213333333333 | | Weekly Target 4 | 94.09 | | Weekly Target 5 | 94.74 |
Weekly price and volumes for Japan Smallcap
| Date |
Closing |
Open |
Range |
Volume |
Thu 23 October 2025 |
93.43 (0.61%) |
93.53 |
92.34 - 93.87 |
0.4232 times |
Fri 17 October 2025 |
92.86 (3.13%) |
90.21 |
89.97 - 92.89 |
0.5549 times |
Fri 10 October 2025 |
90.04 (-4.83%) |
94.35 |
89.61 - 94.75 |
0.9242 times |
Fri 03 October 2025 |
94.61 (-0.9%) |
95.58 |
93.06 - 95.64 |
0.9588 times |
Fri 26 September 2025 |
95.47 (0.23%) |
95.39 |
94.56 - 96.05 |
2.8367 times |
Fri 19 September 2025 |
95.25 (-0.46%) |
96.01 |
95.22 - 96.81 |
1.2437 times |
Fri 12 September 2025 |
95.69 (0.97%) |
95.75 |
95.25 - 96.41 |
0.7788 times |
Fri 05 September 2025 |
94.77 (1.59%) |
92.62 |
92.62 - 95.15 |
0.6702 times |
Fri 29 August 2025 |
93.29 (0%) |
93.19 |
93.18 - 93.42 |
0.3516 times |
Fri 29 August 2025 |
93.29 (-0.73%) |
93.45 |
92.60 - 93.86 |
1.2579 times |
Fri 22 August 2025 |
93.98 (1.78%) |
92.49 |
92.42 - 94.22 |
1.7629 times |

Monthly price and charts JapanSmallcap Strong monthly Stock price targets for JapanSmallcap DFJ are 88.87 and 94.17 | Monthly Target 1 | 87.35 | | Monthly Target 2 | 90.39 | | Monthly Target 3 | 92.65 | | Monthly Target 4 | 95.69 | | Monthly Target 5 | 97.95 |
Monthly price and volumes Japan Smallcap
| Date |
Closing |
Open |
Range |
Volume |
Thu 23 October 2025 |
93.43 (-1.48%) |
94.13 |
89.61 - 94.91 |
0.2763 times |
Tue 30 September 2025 |
94.83 (1.65%) |
92.62 |
92.62 - 96.81 |
0.6295 times |
Fri 29 August 2025 |
93.29 (7.24%) |
88.30 |
87.93 - 94.22 |
0.6425 times |
Thu 31 July 2025 |
86.99 (1.52%) |
85.91 |
83.54 - 88.24 |
0.6403 times |
Mon 30 June 2025 |
85.69 (1.26%) |
85.62 |
83.39 - 86.10 |
1.1192 times |
Fri 30 May 2025 |
84.62 (2.37%) |
81.42 |
81.05 - 84.83 |
0.8173 times |
Wed 30 April 2025 |
82.66 (4.28%) |
78.63 |
70.04 - 83.13 |
1.9306 times |
Mon 31 March 2025 |
79.27 (2.99%) |
78.02 |
77.44 - 81.18 |
1.9809 times |
Fri 28 February 2025 |
76.97 (1.37%) |
75.25 |
74.95 - 77.94 |
0.8147 times |
Fri 31 January 2025 |
75.93 (1.05%) |
75.22 |
72.33 - 77.05 |
1.1486 times |
Tue 31 December 2024 |
75.14 (-1.31%) |
79.14 |
74.37 - 79.27 |
1.2516 times |

DMA SMA EMA moving averages of Japan Smallcap DFJ
DMA (daily moving average) of Japan Smallcap DFJ
| DMA period | DMA value | | 5 day DMA | 93.08 | | 12 day DMA | 92.18 | | 20 day DMA | 93.06 | | 35 day DMA | 94.19 | | 50 day DMA | 93.89 | | 100 day DMA | 90.23 | | 150 day DMA | 86.98 | | 200 day DMA | 84.44 | EMA (exponential moving average) of Japan Smallcap DFJ
| EMA period | EMA current | EMA prev | EMA prev2 | | 5 day EMA | 92.97 | 92.74 | 92.62 | | 12 day EMA | 92.83 | 92.72 | 92.68 | | 20 day EMA | 93.07 | 93.03 | 93.04 | | 35 day EMA | 93.24 | 93.23 | 93.25 | | 50 day EMA | 93.64 | 93.65 | 93.68 |
SMA (simple moving average) of Japan Smallcap DFJ
| SMA period | SMA current | SMA prev | SMA prev2 | | 5 day SMA | 93.08 | 92.87 | 92.73 | | 12 day SMA | 92.18 | 92.17 | 92.3 | | 20 day SMA | 93.06 | 93.12 | 93.23 | | 35 day SMA | 94.19 | 94.21 | 94.22 | | 50 day SMA | 93.89 | 93.86 | 93.84 | | 100 day SMA | 90.23 | 90.14 | 90.05 | | 150 day SMA | 86.98 | 86.9 | 86.82 | | 200 day SMA | 84.44 | 84.34 | 84.25 |
|
|
