UltraDow DDM full analysis,charts,indicators,moving averages,SMA,DMA,EMA,ADX,MACD,RSIUltra Dow DDM WideScreen charts, DMA,SMA,EMA technical analysis, forecast prediction, by indicators ADX,MACD,RSI,CCI AMEX stock exchange
Daily price and charts and targets UltraDow Strong Daily Stock price targets for UltraDow DDM are 107.88 and 109.35 | Daily Target 1 | 106.7 | | Daily Target 2 | 107.59 | | Daily Target 3 | 108.17333333333 | | Daily Target 4 | 109.06 | | Daily Target 5 | 109.64 |
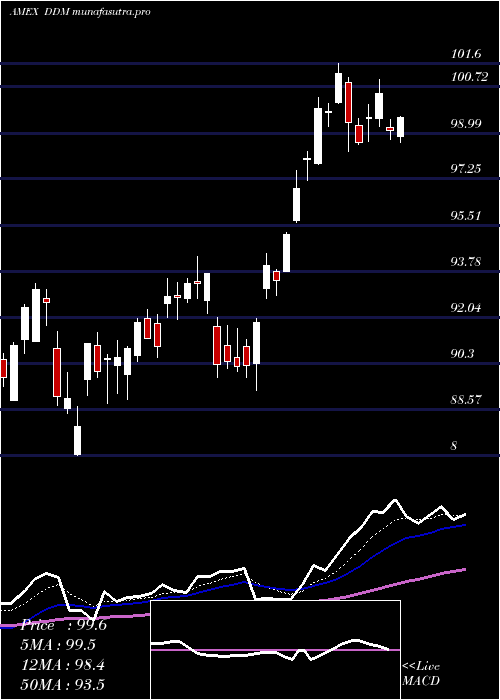
Daily price and volume Ultra Dow
| Date |
Closing |
Open |
Range |
Volume |
Thu 23 October 2025 |
108.47 (0.61%) |
107.59 |
107.29 - 108.76 |
1.1089 times |
Wed 22 October 2025 |
107.81 (-1.48%) |
109.37 |
107.26 - 109.39 |
0.6215 times |
Tue 21 October 2025 |
109.43 (0.96%) |
108.40 |
108.36 - 110.35 |
1.4136 times |
Mon 20 October 2025 |
108.39 (2.23%) |
106.60 |
106.20 - 108.60 |
0.579 times |
Fri 17 October 2025 |
106.03 (0.95%) |
103.95 |
103.95 - 106.62 |
0.5336 times |
Thu 16 October 2025 |
105.03 (-1.29%) |
106.95 |
104.19 - 107.39 |
0.76 times |
Wed 15 October 2025 |
106.40 (-0.11%) |
107.38 |
105.36 - 108.37 |
1.7808 times |
Tue 14 October 2025 |
106.52 (0.9%) |
103.85 |
102.78 - 107.57 |
1.6648 times |
Mon 13 October 2025 |
105.57 (2.53%) |
104.43 |
104.43 - 105.93 |
0.4758 times |
Fri 10 October 2025 |
102.97 (-3.78%) |
107.67 |
102.89 - 108.28 |
1.0621 times |
Thu 09 October 2025 |
107.02 (-1.08%) |
108.20 |
106.59 - 108.48 |
0.7155 times |
Weekly price and charts UltraDow Strong weekly Stock price targets for UltraDow DDM are 107.34 and 111.49 | Weekly Target 1 | 104.19 | | Weekly Target 2 | 106.33 | | Weekly Target 3 | 108.34 | | Weekly Target 4 | 110.48 | | Weekly Target 5 | 112.49 |
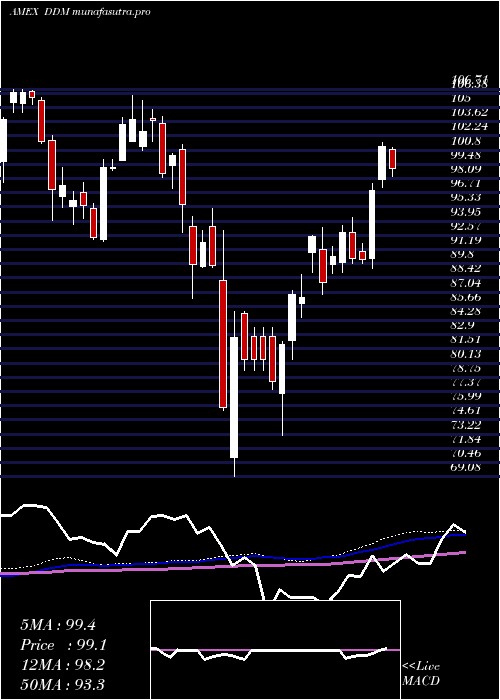
Weekly price and volumes for Ultra Dow
| Date |
Closing |
Open |
Range |
Volume |
Thu 23 October 2025 |
108.47 (2.3%) |
106.60 |
106.20 - 110.35 |
1.4009 times |
Fri 17 October 2025 |
106.03 (2.97%) |
104.43 |
102.78 - 108.37 |
1.9623 times |
Fri 10 October 2025 |
102.97 (-5.45%) |
109.16 |
102.89 - 109.39 |
1.4839 times |
Fri 03 October 2025 |
108.91 (2.16%) |
107.27 |
105.92 - 110.20 |
0.9216 times |
Fri 26 September 2025 |
106.61 (-0.62%) |
106.46 |
104.54 - 109.17 |
0.712 times |
Fri 19 September 2025 |
107.28 (2.01%) |
105.47 |
104.47 - 107.65 |
0.6061 times |
Fri 12 September 2025 |
105.17 (1.75%) |
103.47 |
102.73 - 106.57 |
0.9478 times |
Fri 05 September 2025 |
103.36 (-0.57%) |
102.05 |
101.21 - 105.00 |
0.9785 times |
Fri 29 August 2025 |
103.95 (0%) |
103.97 |
103.17 - 104.29 |
0.2494 times |
Fri 29 August 2025 |
103.95 (-0.39%) |
103.88 |
102.44 - 104.49 |
0.7375 times |
Fri 22 August 2025 |
104.36 (3.07%) |
101.20 |
99.68 - 104.89 |
0.9331 times |
Monthly price and charts UltraDow Strong monthly Stock price targets for UltraDow DDM are 105.63 and 113.2 | Monthly Target 1 | 99.63 | | Monthly Target 2 | 104.05 | | Monthly Target 3 | 107.2 | | Monthly Target 4 | 111.62 | | Monthly Target 5 | 114.77 |
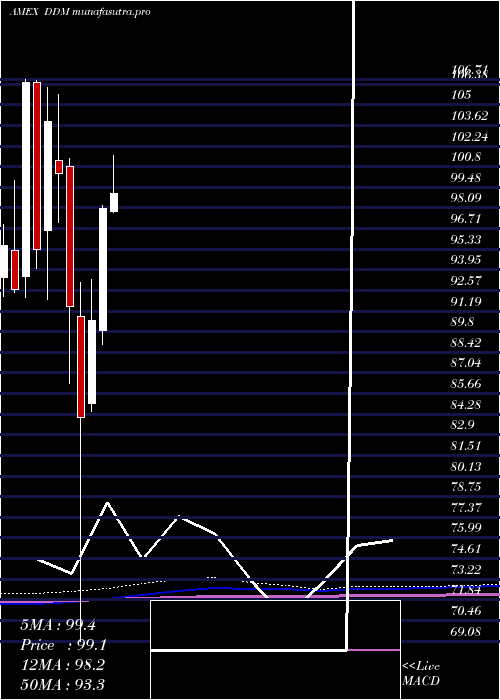
Monthly price and volumes Ultra Dow
| Date |
Closing |
Open |
Range |
Volume |
Thu 23 October 2025 |
108.47 (1.11%) |
106.66 |
102.78 - 110.35 |
0.909 times |
Tue 30 September 2025 |
107.28 (3.2%) |
102.05 |
101.21 - 109.17 |
0.5702 times |
Fri 29 August 2025 |
103.95 (6.3%) |
96.20 |
94.31 - 104.89 |
0.8095 times |
Thu 31 July 2025 |
97.79 (-0.24%) |
97.85 |
96.41 - 101.95 |
1.4115 times |
Mon 30 June 2025 |
98.03 (8.3%) |
89.87 |
88.94 - 98.27 |
0.6906 times |
Fri 30 May 2025 |
90.52 (7.7%) |
85.00 |
84.48 - 93.30 |
0.9934 times |
Wed 30 April 2025 |
84.05 (-8.13%) |
90.84 |
69.08 - 93.07 |
1.8207 times |
Mon 31 March 2025 |
91.49 (-8.85%) |
100.86 |
86.37 - 101.40 |
0.8896 times |
Fri 28 February 2025 |
100.37 (-3.36%) |
101.24 |
97.14 - 105.68 |
0.703 times |
Fri 31 January 2025 |
103.86 (8.98%) |
96.60 |
91.95 - 106.16 |
1.2026 times |
Tue 31 December 2024 |
95.30 (-10.52%) |
106.52 |
94.05 - 106.62 |
1.0123 times |
DMA SMA EMA moving averages of Ultra Dow DDM
DMA (daily moving average) of Ultra Dow DDM
| DMA period | DMA value | | 5 day DMA | 108.03 | | 12 day DMA | 106.82 | | 20 day DMA | 107.18 | | 35 day DMA | 106.5 | | 50 day DMA | 105.38 | | 100 day DMA | 101.07 | | 150 day DMA | 96.03 | | 200 day DMA | 96.73 | EMA (exponential moving average) of Ultra Dow DDM
| EMA period | EMA current | EMA prev | EMA prev2 | | 5 day EMA | 107.95 | 107.69 | 107.63 | | 12 day EMA | 107.35 | 107.15 | 107.03 | | 20 day EMA | 106.97 | 106.81 | 106.71 | | 35 day EMA | 106.01 | 105.86 | 105.75 | | 50 day EMA | 105.15 | 105.01 | 104.9 |
SMA (simple moving average) of Ultra Dow DDM
| SMA period | SMA current | SMA prev | SMA prev2 | | 5 day SMA | 108.03 | 107.34 | 107.06 | | 12 day SMA | 106.82 | 106.79 | 106.86 | | 20 day SMA | 107.18 | 107.02 | 106.94 | | 35 day SMA | 106.5 | 106.38 | 106.23 | | 50 day SMA | 105.38 | 105.23 | 105.09 | | 100 day SMA | 101.07 | 100.89 | 100.72 | | 150 day SMA | 96.03 | 95.92 | 95.8 | | 200 day SMA | 96.73 | 96.67 | 96.61 |
|
|
