MidcapCore CZA full analysis,charts,indicators,moving averages,SMA,DMA,EMA,ADX,MACD,RSIMidcap Core CZA WideScreen charts, DMA,SMA,EMA technical analysis, forecast prediction, by indicators ADX,MACD,RSI,CCI AMEX stock exchange
Daily price and charts and targets MidcapCore Strong Daily Stock price targets for MidcapCore CZA are 110.6 and 110.64 | Daily Target 1 | 110.59 | | Daily Target 2 | 110.61 | | Daily Target 3 | 110.63333333333 | | Daily Target 4 | 110.65 | | Daily Target 5 | 110.67 |
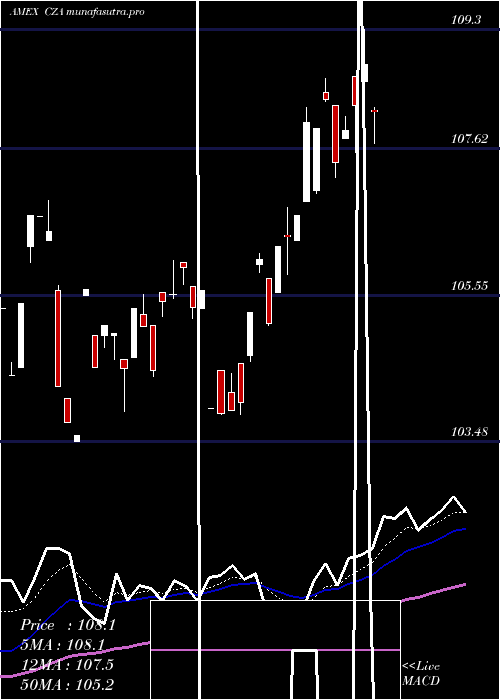
Daily price and volume Midcap Core
| Date |
Closing |
Open |
Range |
Volume |
Fri 24 October 2025 |
110.62 (0.55%) |
110.66 |
110.62 - 110.66 |
0.7624 times |
Thu 23 October 2025 |
110.02 (0.37%) |
109.28 |
109.28 - 110.02 |
0.3872 times |
Wed 22 October 2025 |
109.61 (-0.59%) |
109.24 |
109.24 - 110.06 |
2.0876 times |
Tue 21 October 2025 |
110.26 (0.9%) |
109.83 |
109.83 - 110.26 |
0.4502 times |
Mon 20 October 2025 |
109.28 (0.95%) |
109.02 |
109.02 - 109.28 |
0.3647 times |
Fri 17 October 2025 |
108.25 (0.5%) |
107.62 |
107.62 - 108.25 |
0.7219 times |
Thu 16 October 2025 |
107.71 (-0.96%) |
108.40 |
107.43 - 108.40 |
1.4738 times |
Wed 15 October 2025 |
108.75 (0.08%) |
108.81 |
108.69 - 108.81 |
3.0017 times |
Tue 14 October 2025 |
108.66 (0.92%) |
108.45 |
108.45 - 108.66 |
0.4502 times |
Mon 13 October 2025 |
107.67 (0.81%) |
107.67 |
107.67 - 107.67 |
0.3002 times |
Fri 10 October 2025 |
106.81 (-2.05%) |
108.23 |
106.81 - 108.23 |
5.403 times |
Weekly price and charts MidcapCore Strong weekly Stock price targets for MidcapCore CZA are 109.82 and 111.46 | Weekly Target 1 | 108.46 | | Weekly Target 2 | 109.54 | | Weekly Target 3 | 110.1 | | Weekly Target 4 | 111.18 | | Weekly Target 5 | 111.74 |
Weekly price and volumes for Midcap Core
| Date |
Closing |
Open |
Range |
Volume |
Fri 24 October 2025 |
110.62 (2.19%) |
109.02 |
109.02 - 110.66 |
0.3141 times |
Fri 17 October 2025 |
108.25 (1.35%) |
107.67 |
107.43 - 108.81 |
0.461 times |
Fri 10 October 2025 |
106.81 (-3.4%) |
110.06 |
106.81 - 110.76 |
2.1745 times |
Fri 03 October 2025 |
110.57 (1.39%) |
108.84 |
108.84 - 111.01 |
0.7567 times |
Fri 26 September 2025 |
109.05 (0.11%) |
108.51 |
107.67 - 109.48 |
2.2685 times |
Fri 19 September 2025 |
108.93 (-0.6%) |
109.62 |
108.05 - 109.80 |
1.4891 times |
Fri 12 September 2025 |
109.59 (0.08%) |
109.03 |
108.18 - 110.64 |
0.826 times |
Fri 05 September 2025 |
109.50 (0.13%) |
108.00 |
108.00 - 109.56 |
0.6398 times |
Fri 29 August 2025 |
109.36 (0%) |
108.95 |
108.95 - 109.75 |
0.2676 times |
Fri 29 August 2025 |
109.36 (-0.88%) |
109.83 |
108.95 - 109.83 |
0.8027 times |
Fri 22 August 2025 |
110.33 (2.66%) |
107.48 |
106.77 - 110.82 |
0.7794 times |
Monthly price and charts MidcapCore Strong monthly Stock price targets for MidcapCore CZA are 108.72 and 112.92 | Monthly Target 1 | 105.28 | | Monthly Target 2 | 107.95 | | Monthly Target 3 | 109.48 | | Monthly Target 4 | 112.15 | | Monthly Target 5 | 113.68 |
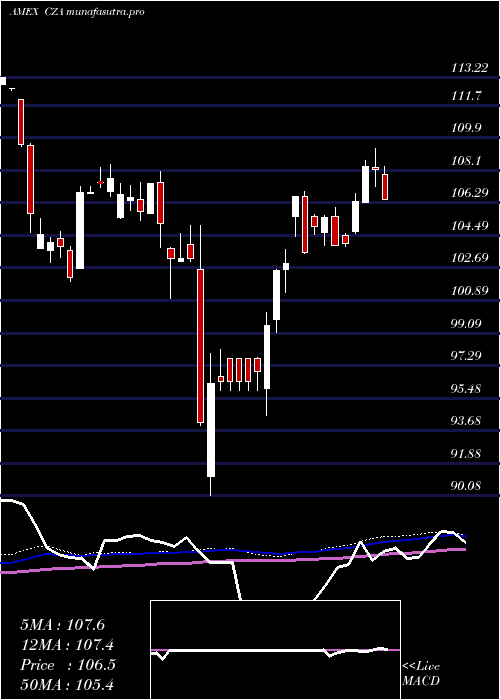
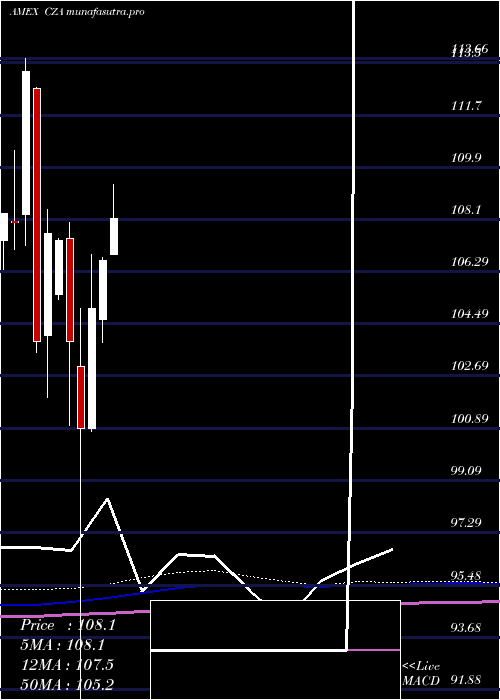
Monthly price and volumes Midcap Core
| Date |
Closing |
Open |
Range |
Volume |
Fri 24 October 2025 |
110.62 (0.7%) |
109.64 |
106.81 - 111.01 |
0.5044 times |
Tue 30 September 2025 |
109.85 (0.45%) |
108.00 |
107.67 - 110.64 |
0.8609 times |
Fri 29 August 2025 |
109.36 (2.91%) |
105.59 |
104.49 - 110.82 |
0.6528 times |
Thu 31 July 2025 |
106.27 (-0.37%) |
106.88 |
105.70 - 109.30 |
1.1329 times |
Mon 30 June 2025 |
106.67 (1.58%) |
104.65 |
103.86 - 106.78 |
1.2219 times |
Fri 30 May 2025 |
105.01 (4.11%) |
100.89 |
100.78 - 106.89 |
0.5336 times |
Wed 30 April 2025 |
100.86 (-2.92%) |
103.00 |
90.08 - 105.04 |
1.1315 times |
Mon 31 March 2025 |
103.89 (-3.25%) |
107.43 |
100.98 - 108.00 |
0.8109 times |
Fri 28 February 2025 |
107.38 (-0.21%) |
105.49 |
105.33 - 107.42 |
1.0494 times |
Fri 31 January 2025 |
107.61 (3.58%) |
104.07 |
101.94 - 108.43 |
2.1017 times |
Tue 31 December 2024 |
103.89 (-8.24%) |
112.62 |
103.50 - 112.64 |
0.7241 times |
DMA SMA EMA moving averages of Midcap Core CZA
DMA (daily moving average) of Midcap Core CZA
| DMA period | DMA value | | 5 day DMA | 109.96 | | 12 day DMA | 108.89 | | 20 day DMA | 109.33 | | 35 day DMA | 109.16 | | 50 day DMA | 109.13 | | 100 day DMA | 107.92 | | 150 day DMA | 105.63 | | 200 day DMA | 105.68 | EMA (exponential moving average) of Midcap Core CZA
| EMA period | EMA current | EMA prev | EMA prev2 | | 5 day EMA | 109.91 | 109.55 | 109.31 | | 12 day EMA | 109.44 | 109.22 | 109.07 | | 20 day EMA | 109.27 | 109.13 | 109.04 | | 35 day EMA | 109.17 | 109.08 | 109.02 | | 50 day EMA | 109.09 | 109.03 | 108.99 |
SMA (simple moving average) of Midcap Core CZA
| SMA period | SMA current | SMA prev | SMA prev2 | | 5 day SMA | 109.96 | 109.48 | 109.02 | | 12 day SMA | 108.89 | 108.85 | 108.83 | | 20 day SMA | 109.33 | 109.26 | 109.14 | | 35 day SMA | 109.16 | 109.13 | 109.11 | | 50 day SMA | 109.13 | 109.06 | 109.03 | | 100 day SMA | 107.92 | 107.86 | 107.81 | | 150 day SMA | 105.63 | 105.58 | 105.54 | | 200 day SMA | 105.68 | 105.64 | 105.61 |
|
|
