AdvisorsharesFocused CWS full analysis,charts,indicators,moving averages,SMA,DMA,EMA,ADX,MACD,RSIAdvisorshares Focused CWS WideScreen charts, DMA,SMA,EMA technical analysis, forecast prediction, by indicators ADX,MACD,RSI,CCI AMEX stock exchange
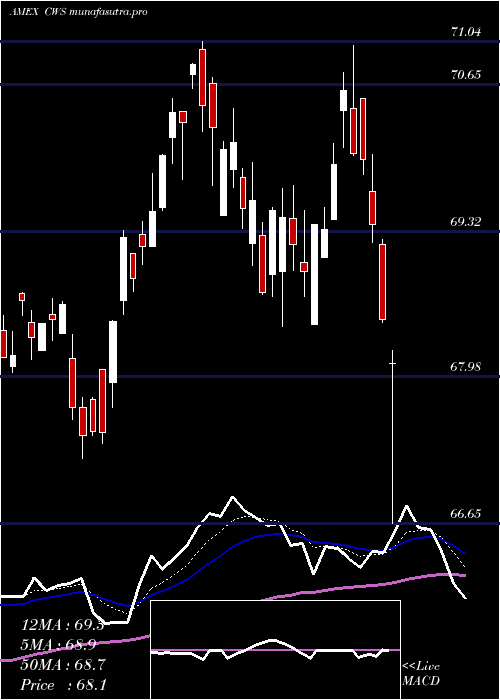
Daily price and charts and targets AdvisorsharesFocused Strong Daily Stock price targets for AdvisorsharesFocused CWS are 69.18 and 69.5 | Daily Target 1 | 68.93 | | Daily Target 2 | 69.11 | | Daily Target 3 | 69.25 | | Daily Target 4 | 69.43 | | Daily Target 5 | 69.57 |
Daily price and volume Advisorshares Focused
| Date |
Closing |
Open |
Range |
Volume |
Thu 23 October 2025 |
69.29 (0.73%) |
69.18 |
69.07 - 69.39 |
0.8018 times |
Wed 22 October 2025 |
68.79 (-0.45%) |
68.94 |
68.69 - 69.19 |
0.5059 times |
Tue 21 October 2025 |
69.10 (0.66%) |
68.34 |
68.34 - 69.12 |
0.9317 times |
Mon 20 October 2025 |
68.65 (1.21%) |
68.19 |
68.19 - 68.82 |
3.8315 times |
Fri 17 October 2025 |
67.83 (0.59%) |
67.23 |
67.23 - 67.84 |
0.9945 times |
Thu 16 October 2025 |
67.43 (-0.82%) |
68.16 |
67.35 - 68.16 |
0.4533 times |
Wed 15 October 2025 |
67.99 (-0.26%) |
68.07 |
67.65 - 68.61 |
0.7846 times |
Tue 14 October 2025 |
68.17 (0.84%) |
66.94 |
66.94 - 68.36 |
0.5885 times |
Mon 13 October 2025 |
67.60 (0.73%) |
67.17 |
67.17 - 67.91 |
0.6571 times |
Fri 10 October 2025 |
67.11 (-1.73%) |
68.14 |
67.11 - 68.50 |
0.4511 times |
Thu 09 October 2025 |
68.29 (-0.93%) |
68.62 |
68.23 - 68.62 |
1.1377 times |
Weekly price and charts AdvisorsharesFocused Strong weekly Stock price targets for AdvisorsharesFocused CWS are 68.74 and 69.94 | Weekly Target 1 | 67.76 | | Weekly Target 2 | 68.52 | | Weekly Target 3 | 68.956666666667 | | Weekly Target 4 | 69.72 | | Weekly Target 5 | 70.16 |
Weekly price and volumes for Advisorshares Focused
| Date |
Closing |
Open |
Range |
Volume |
Thu 23 October 2025 |
69.29 (2.15%) |
68.19 |
68.19 - 69.39 |
1.4179 times |
Fri 17 October 2025 |
67.83 (1.07%) |
67.17 |
66.94 - 68.61 |
0.8123 times |
Fri 10 October 2025 |
67.11 (-2.57%) |
68.85 |
67.11 - 68.95 |
1.2366 times |
Fri 03 October 2025 |
68.88 (0.86%) |
68.73 |
67.87 - 69.28 |
1.0794 times |
Fri 26 September 2025 |
68.29 (-0.1%) |
68.02 |
67.27 - 68.98 |
1.0811 times |
Fri 19 September 2025 |
68.36 (-1.34%) |
69.19 |
67.79 - 69.33 |
1.0651 times |
Fri 12 September 2025 |
69.29 (0.62%) |
68.99 |
68.28 - 69.96 |
1.5026 times |
Fri 05 September 2025 |
68.86 (-0.2%) |
68.23 |
68.15 - 69.22 |
0.9048 times |
Fri 29 August 2025 |
69.00 (0%) |
69.29 |
68.87 - 69.29 |
0.0848 times |
Fri 29 August 2025 |
69.00 (-0.68%) |
69.55 |
68.87 - 69.82 |
0.8154 times |
Fri 22 August 2025 |
69.47 (1.24%) |
68.42 |
68.42 - 69.87 |
0.9116 times |
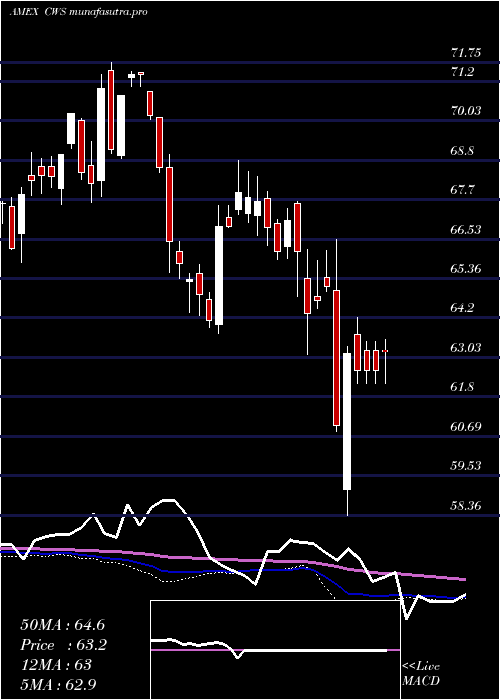
Monthly price and charts AdvisorsharesFocused Strong monthly Stock price targets for AdvisorsharesFocused CWS are 68.12 and 70.57 | Monthly Target 1 | 66.09 | | Monthly Target 2 | 67.69 | | Monthly Target 3 | 68.54 | | Monthly Target 4 | 70.14 | | Monthly Target 5 | 70.99 |
Monthly price and volumes Advisorshares Focused
| Date |
Closing |
Open |
Range |
Volume |
Thu 23 October 2025 |
69.29 (0.96%) |
67.87 |
66.94 - 69.39 |
0.8666 times |
Tue 30 September 2025 |
68.63 (-0.54%) |
68.23 |
67.27 - 69.96 |
0.9737 times |
Fri 29 August 2025 |
69.00 (0.72%) |
68.10 |
66.65 - 69.87 |
0.7458 times |
Thu 31 July 2025 |
68.51 (-2.13%) |
70.16 |
68.44 - 71.04 |
0.8906 times |
Mon 30 June 2025 |
70.00 (2.29%) |
68.01 |
67.24 - 70.01 |
0.8088 times |
Fri 30 May 2025 |
68.43 (5.31%) |
64.57 |
64.57 - 69.38 |
0.7481 times |
Wed 30 April 2025 |
64.98 (-0.75%) |
65.19 |
58.36 - 66.53 |
1.9096 times |
Mon 31 March 2025 |
65.47 (-2.39%) |
67.58 |
63.10 - 67.64 |
0.8784 times |
Fri 28 February 2025 |
67.07 (-1.02%) |
67.23 |
65.92 - 68.38 |
0.9005 times |
Fri 31 January 2025 |
67.76 (4.62%) |
64.91 |
63.74 - 68.84 |
1.2779 times |
Tue 31 December 2024 |
64.77 (-9.27%) |
70.90 |
64.36 - 70.90 |
1.0652 times |

DMA SMA EMA moving averages of Advisorshares Focused CWS
DMA (daily moving average) of Advisorshares Focused CWS
| DMA period | DMA value | | 5 day DMA | 68.73 | | 12 day DMA | 68.27 | | 20 day DMA | 68.39 | | 35 day DMA | 68.51 | | 50 day DMA | 68.64 | | 100 day DMA | 68.84 | | 150 day DMA | 67.64 | | 200 day DMA | 67.34 | EMA (exponential moving average) of Advisorshares Focused CWS
| EMA period | EMA current | EMA prev | EMA prev2 | | 5 day EMA | 68.8 | 68.55 | 68.43 | | 12 day EMA | 68.5 | 68.36 | 68.28 | | 20 day EMA | 68.45 | 68.36 | 68.32 | | 35 day EMA | 68.53 | 68.49 | 68.47 | | 50 day EMA | 68.68 | 68.65 | 68.64 |
SMA (simple moving average) of Advisorshares Focused CWS
| SMA period | SMA current | SMA prev | SMA prev2 | | 5 day SMA | 68.73 | 68.36 | 68.2 | | 12 day SMA | 68.27 | 68.23 | 68.23 | | 20 day SMA | 68.39 | 68.31 | 68.27 | | 35 day SMA | 68.51 | 68.49 | 68.48 | | 50 day SMA | 68.64 | 68.63 | 68.64 | | 100 day SMA | 68.84 | 68.83 | 68.83 | | 150 day SMA | 67.64 | 67.61 | 67.59 | | 200 day SMA | 67.34 | 67.31 | 67.3 |
|
|
