CelSci CVM full analysis,charts,indicators,moving averages,SMA,DMA,EMA,ADX,MACD,RSICel Sci CVM WideScreen charts, DMA,SMA,EMA technical analysis, forecast prediction, by indicators ADX,MACD,RSI,CCI AMEX stock exchange
Daily price and charts and targets CelSci Strong Daily Stock price targets for CelSci CVM are 8.8 and 9.12 | Daily Target 1 | 8.72 | | Daily Target 2 | 8.87 | | Daily Target 3 | 9.04 | | Daily Target 4 | 9.19 | | Daily Target 5 | 9.36 |
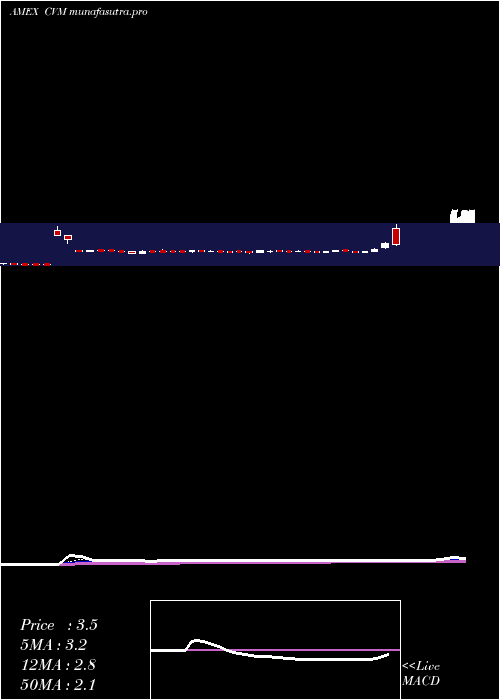
Daily price and volume Cel Sci
| Date |
Closing |
Open |
Range |
Volume |
Thu 23 October 2025 |
9.02 (-2.49%) |
9.05 |
8.89 - 9.21 |
0.284 times |
Wed 22 October 2025 |
9.25 (0.43%) |
9.90 |
8.92 - 9.90 |
0.7386 times |
Tue 21 October 2025 |
9.21 (1.21%) |
9.11 |
8.50 - 9.33 |
2.0296 times |
Mon 20 October 2025 |
9.10 (2.82%) |
8.74 |
8.74 - 9.44 |
0.5913 times |
Fri 17 October 2025 |
8.85 (-7.81%) |
9.60 |
8.61 - 9.85 |
2.0396 times |
Thu 16 October 2025 |
9.60 (-5.04%) |
10.05 |
9.60 - 10.16 |
0.6359 times |
Wed 15 October 2025 |
10.11 (2.43%) |
9.91 |
9.81 - 10.24 |
0.6113 times |
Tue 14 October 2025 |
9.87 (-0.3%) |
9.72 |
9.65 - 10.04 |
0.8966 times |
Mon 13 October 2025 |
9.90 (3.02%) |
9.57 |
9.51 - 10.14 |
1.0971 times |
Fri 10 October 2025 |
9.61 (-3.22%) |
9.95 |
9.37 - 10.08 |
1.0759 times |
Thu 09 October 2025 |
9.93 (-1%) |
10.00 |
9.62 - 10.39 |
1.0172 times |
Weekly price and charts CelSci Strong weekly Stock price targets for CelSci CVM are 8.76 and 10.16 | Weekly Target 1 | 7.74 | | Weekly Target 2 | 8.38 | | Weekly Target 3 | 9.14 | | Weekly Target 4 | 9.78 | | Weekly Target 5 | 10.54 |
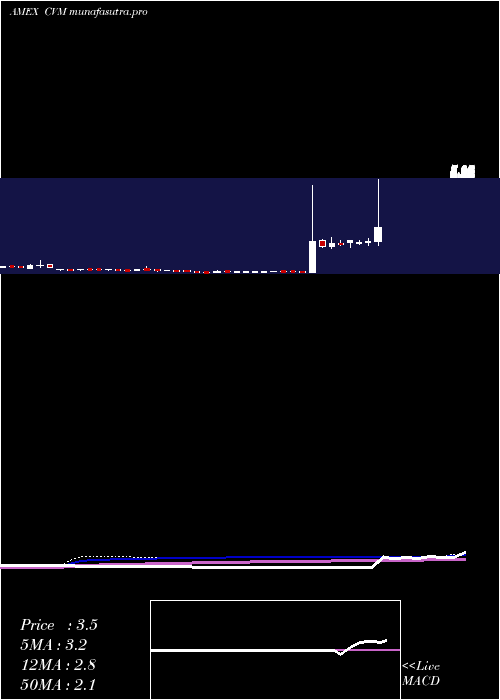
Weekly price and volumes for Cel Sci
| Date |
Closing |
Open |
Range |
Volume |
Thu 23 October 2025 |
9.02 (1.92%) |
8.74 |
8.50 - 9.90 |
0.2618 times |
Fri 17 October 2025 |
8.85 (-7.91%) |
9.57 |
8.61 - 10.24 |
0.3794 times |
Fri 10 October 2025 |
9.61 (-8.21%) |
10.50 |
9.37 - 10.70 |
0.3563 times |
Fri 03 October 2025 |
10.47 (16.98%) |
8.86 |
8.69 - 10.83 |
0.5981 times |
Fri 26 September 2025 |
8.95 (3.23%) |
8.67 |
8.44 - 9.36 |
0.5273 times |
Fri 19 September 2025 |
8.67 (-15.41%) |
10.25 |
8.45 - 10.48 |
1.365 times |
Fri 12 September 2025 |
10.25 (-2.29%) |
10.55 |
9.58 - 11.40 |
1.1039 times |
Fri 05 September 2025 |
10.49 (0.58%) |
10.59 |
10.40 - 12.68 |
1.3931 times |
Fri 29 August 2025 |
10.43 (0%) |
9.12 |
9.06 - 10.87 |
0.6065 times |
Fri 29 August 2025 |
10.43 (9.56%) |
9.60 |
8.65 - 13.48 |
3.4085 times |
Fri 22 August 2025 |
9.52 (9.43%) |
8.70 |
8.04 - 9.86 |
0.9615 times |
Monthly price and charts CelSci Strong monthly Stock price targets for CelSci CVM are 7.6 and 9.93 | Monthly Target 1 | 7.12 | | Monthly Target 2 | 8.07 | | Monthly Target 3 | 9.45 | | Monthly Target 4 | 10.4 | | Monthly Target 5 | 11.78 |
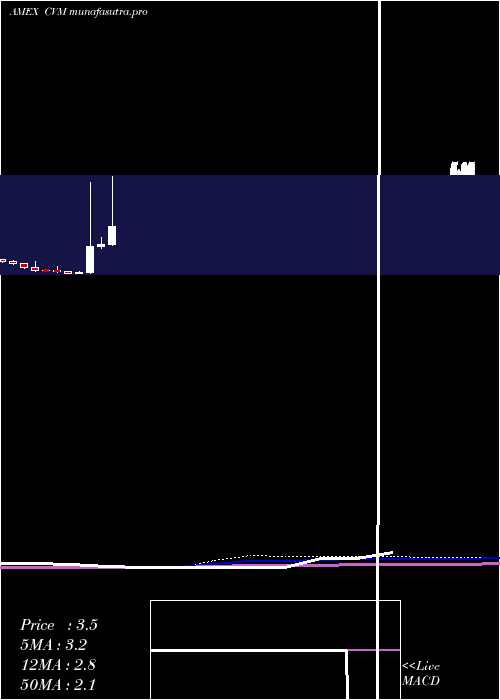
Monthly price and volumes Cel Sci
| Date |
Closing |
Open |
Range |
Volume |
Thu 23 October 2025 |
9.02 (-1.96%) |
9.24 |
8.50 - 10.83 |
0.0629 times |
Tue 30 September 2025 |
9.20 (-11.79%) |
10.59 |
8.44 - 12.68 |
0.2081 times |
Fri 29 August 2025 |
10.43 (27.51%) |
8.07 |
6.84 - 13.48 |
0.3823 times |
Thu 31 July 2025 |
8.18 (257.21%) |
2.26 |
2.21 - 10.40 |
2.1097 times |
Mon 30 June 2025 |
2.29 (9.05%) |
2.10 |
1.98 - 2.78 |
0.2809 times |
Fri 30 May 2025 |
2.10 (624.14%) |
0.29 |
0.20 - 6.64 |
1.1087 times |
Wed 30 April 2025 |
0.29 (26.09%) |
0.23 |
0.18 - 0.32 |
1.5449 times |
Mon 31 March 2025 |
0.23 (-30.3%) |
0.34 |
0.22 - 0.35 |
1.9232 times |
Fri 28 February 2025 |
0.33 (-15.38%) |
0.39 |
0.31 - 0.68 |
1.2398 times |
Fri 31 January 2025 |
0.39 (-2.5%) |
0.42 |
0.36 - 0.46 |
1.1396 times |
Tue 31 December 2024 |
0.40 (-35.48%) |
0.63 |
0.37 - 1.09 |
1.6511 times |
DMA SMA EMA moving averages of Cel Sci CVM
DMA (daily moving average) of Cel Sci CVM
| DMA period | DMA value | | 5 day DMA | 9.09 | | 12 day DMA | 9.54 | | 20 day DMA | 9.62 | | 35 day DMA | 9.56 | | 50 day DMA | 9.77 | | 100 day DMA | 7.13 | | 150 day DMA | 4.99 | | 200 day DMA | 3.83 | EMA (exponential moving average) of Cel Sci CVM
| EMA period | EMA current | EMA prev | EMA prev2 | | 5 day EMA | 9.21 | 9.3 | 9.32 | | 12 day EMA | 9.4 | 9.47 | 9.51 | | 20 day EMA | 9.49 | 9.54 | 9.57 | | 35 day EMA | 9.57 | 9.6 | 9.62 | | 50 day EMA | 9.54 | 9.56 | 9.57 |
SMA (simple moving average) of Cel Sci CVM
| SMA period | SMA current | SMA prev | SMA prev2 | | 5 day SMA | 9.09 | 9.2 | 9.37 | | 12 day SMA | 9.54 | 9.64 | 9.71 | | 20 day SMA | 9.62 | 9.59 | 9.58 | | 35 day SMA | 9.56 | 9.62 | 9.7 | | 50 day SMA | 9.77 | 9.75 | 9.73 | | 100 day SMA | 7.13 | 7.07 | 7 | | 150 day SMA | 4.99 | 4.93 | 4.87 | | 200 day SMA | 3.83 | 3.79 | 3.75 |
|
|
