TimberGuggenheim CUT full analysis,charts,indicators,moving averages,SMA,DMA,EMA,ADX,MACD,RSITimber Guggenheim CUT WideScreen charts, DMA,SMA,EMA technical analysis, forecast prediction, by indicators ADX,MACD,RSI,CCI AMEX stock exchange
Daily price and charts and targets TimberGuggenheim Strong Daily Stock price targets for TimberGuggenheim CUT are 29.16 and 29.16 | Daily Target 1 | 29.16 | | Daily Target 2 | 29.16 | | Daily Target 3 | 29.16 | | Daily Target 4 | 29.16 | | Daily Target 5 | 29.16 |
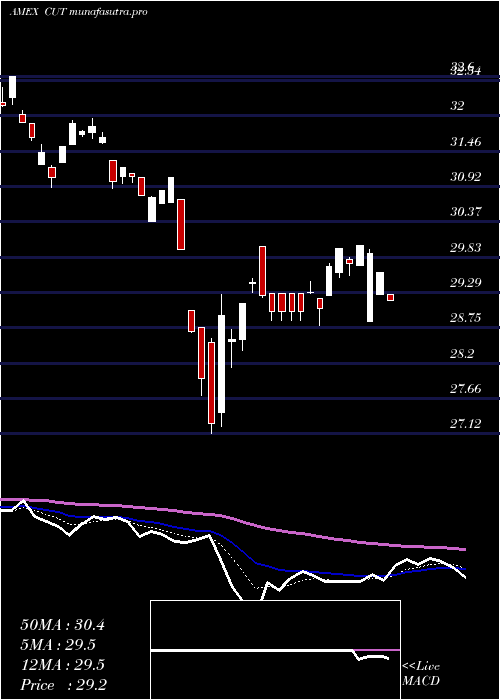
Daily price and volume Timber Guggenheim
| Date |
Closing |
Open |
Range |
Volume |
Thu 23 October 2025 |
29.16 (0.69%) |
29.16 |
29.16 - 29.16 |
0.0758 times |
Wed 22 October 2025 |
28.96 (0.73%) |
29.03 |
28.94 - 29.10 |
5.2429 times |
Tue 21 October 2025 |
28.75 (0.59%) |
28.51 |
28.51 - 28.75 |
0.7895 times |
Mon 20 October 2025 |
28.58 (0.49%) |
28.52 |
28.52 - 28.58 |
0.1945 times |
Fri 17 October 2025 |
28.44 (0.6%) |
28.35 |
28.35 - 28.45 |
0.4444 times |
Thu 16 October 2025 |
28.27 (-0.46%) |
28.44 |
28.27 - 28.47 |
0.2842 times |
Wed 15 October 2025 |
28.40 (-0.18%) |
28.50 |
28.40 - 28.50 |
0.5053 times |
Tue 14 October 2025 |
28.45 (0.82%) |
28.00 |
28.00 - 28.61 |
0.379 times |
Mon 13 October 2025 |
28.22 (0.5%) |
28.24 |
28.10 - 28.36 |
1.4528 times |
Fri 10 October 2025 |
28.08 (-1.89%) |
28.20 |
28.08 - 28.20 |
0.6316 times |
Thu 09 October 2025 |
28.62 (-0.76%) |
28.81 |
28.58 - 28.86 |
1.5159 times |
Weekly price and charts TimberGuggenheim Strong weekly Stock price targets for TimberGuggenheim CUT are 28.84 and 29.49 | Weekly Target 1 | 28.29 | | Weekly Target 2 | 28.73 | | Weekly Target 3 | 28.943333333333 | | Weekly Target 4 | 29.38 | | Weekly Target 5 | 29.59 |
Weekly price and volumes for Timber Guggenheim
| Date |
Closing |
Open |
Range |
Volume |
Thu 23 October 2025 |
29.16 (2.53%) |
28.52 |
28.51 - 29.16 |
0.7372 times |
Fri 17 October 2025 |
28.44 (1.28%) |
28.24 |
28.00 - 28.61 |
0.3586 times |
Fri 10 October 2025 |
28.08 (-5.9%) |
29.25 |
28.08 - 29.26 |
0.8922 times |
Fri 03 October 2025 |
29.84 (1.95%) |
29.35 |
29.28 - 29.99 |
2.1387 times |
Fri 26 September 2025 |
29.27 (-1.25%) |
29.70 |
29.14 - 29.95 |
0.6575 times |
Fri 19 September 2025 |
29.64 (-2.88%) |
30.48 |
29.64 - 31.05 |
0.6797 times |
Fri 12 September 2025 |
30.52 (-1.52%) |
31.21 |
30.32 - 31.21 |
0.6649 times |
Fri 05 September 2025 |
30.99 (-0.32%) |
30.50 |
30.33 - 30.99 |
0.4507 times |
Fri 29 August 2025 |
31.09 (0%) |
31.05 |
30.94 - 31.09 |
0.2069 times |
Fri 29 August 2025 |
31.09 (-1.8%) |
31.52 |
30.75 - 31.52 |
3.2137 times |
Fri 22 August 2025 |
31.66 (3.5%) |
30.52 |
30.34 - 31.67 |
0.2549 times |

Monthly price and charts TimberGuggenheim Strong monthly Stock price targets for TimberGuggenheim CUT are 27.59 and 29.58 | Monthly Target 1 | 27.06 | | Monthly Target 2 | 28.11 | | Monthly Target 3 | 29.05 | | Monthly Target 4 | 30.1 | | Monthly Target 5 | 31.04 |
Monthly price and volumes Timber Guggenheim
| Date |
Closing |
Open |
Range |
Volume |
Thu 23 October 2025 |
29.16 (-1.32%) |
29.84 |
28.00 - 29.99 |
0.6263 times |
Tue 30 September 2025 |
29.55 (-4.95%) |
30.50 |
29.14 - 31.21 |
1.2419 times |
Fri 29 August 2025 |
31.09 (5.78%) |
29.25 |
29.21 - 31.67 |
1.2356 times |
Thu 31 July 2025 |
29.39 (-2.26%) |
30.82 |
29.39 - 31.55 |
0.5914 times |
Mon 30 June 2025 |
30.07 (-1.18%) |
30.10 |
29.57 - 30.90 |
0.5916 times |
Fri 30 May 2025 |
30.43 (2.84%) |
29.26 |
29.12 - 31.13 |
0.6692 times |
Wed 30 April 2025 |
29.59 (-3.74%) |
30.65 |
27.12 - 31.05 |
1.2647 times |
Mon 31 March 2025 |
30.74 (-4.56%) |
32.42 |
30.38 - 32.69 |
0.8682 times |
Fri 28 February 2025 |
32.21 (-2.1%) |
31.30 |
31.30 - 33.17 |
1.1852 times |
Fri 31 January 2025 |
32.90 (3.88%) |
31.83 |
31.19 - 33.52 |
1.7259 times |
Tue 31 December 2024 |
31.67 (-8.31%) |
34.65 |
31.00 - 34.88 |
1.4887 times |

DMA SMA EMA moving averages of Timber Guggenheim CUT
DMA (daily moving average) of Timber Guggenheim CUT
| DMA period | DMA value | | 5 day DMA | 28.78 | | 12 day DMA | 28.56 | | 20 day DMA | 28.91 | | 35 day DMA | 29.48 | | 50 day DMA | 29.9 | | 100 day DMA | 30.22 | | 150 day DMA | 30.13 | | 200 day DMA | 30.69 | EMA (exponential moving average) of Timber Guggenheim CUT
| EMA period | EMA current | EMA prev | EMA prev2 | | 5 day EMA | 28.85 | 28.69 | 28.56 | | 12 day EMA | 28.79 | 28.72 | 28.68 | | 20 day EMA | 28.98 | 28.96 | 28.96 | | 35 day EMA | 29.39 | 29.4 | 29.43 | | 50 day EMA | 29.85 | 29.88 | 29.92 |
SMA (simple moving average) of Timber Guggenheim CUT
| SMA period | SMA current | SMA prev | SMA prev2 | | 5 day SMA | 28.78 | 28.6 | 28.49 | | 12 day SMA | 28.56 | 28.53 | 28.55 | | 20 day SMA | 28.91 | 28.91 | 28.94 | | 35 day SMA | 29.48 | 29.52 | 29.57 | | 50 day SMA | 29.9 | 29.93 | 29.97 | | 100 day SMA | 30.22 | 30.23 | 30.25 | | 150 day SMA | 30.13 | 30.15 | 30.17 | | 200 day SMA | 30.69 | 30.7 | 30.72 |
|
|
