SpinfGuggenheim CSD full analysis,charts,indicators,moving averages,SMA,DMA,EMA,ADX,MACD,RSISpinf Guggenheim CSD WideScreen charts, DMA,SMA,EMA technical analysis, forecast prediction, by indicators ADX,MACD,RSI,CCI AMEX stock exchange
Daily price and charts and targets SpinfGuggenheim Strong Daily Stock price targets for SpinfGuggenheim CSD are 95.79 and 103.83 | Daily Target 1 | 90.11 | | Daily Target 2 | 93.42 | | Daily Target 3 | 98.153333333333 | | Daily Target 4 | 101.46 | | Daily Target 5 | 106.19 |
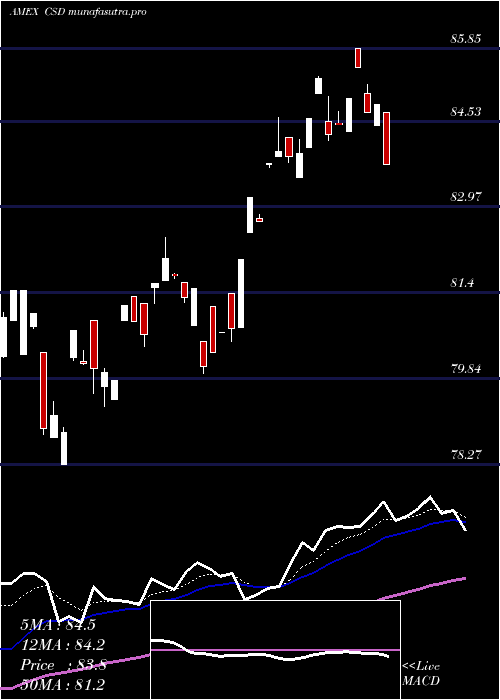
Daily price and volume Spinf Guggenheim
| Date |
Closing |
Open |
Range |
Volume |
Thu 23 October 2025 |
96.72 (1.58%) |
94.85 |
94.85 - 102.89 |
2.4369 times |
Wed 22 October 2025 |
95.22 (-0.95%) |
95.22 |
95.22 - 95.22 |
0.0474 times |
Tue 21 October 2025 |
96.13 (0.35%) |
96.07 |
96.07 - 96.13 |
0.1093 times |
Mon 20 October 2025 |
95.79 (1.39%) |
95.79 |
95.79 - 95.79 |
2.9591 times |
Fri 17 October 2025 |
94.48 (-0.47%) |
94.48 |
94.48 - 94.48 |
0 times |
Thu 16 October 2025 |
94.93 (-0.68%) |
96.23 |
94.93 - 96.23 |
0.0379 times |
Wed 15 October 2025 |
95.58 (1.58%) |
95.74 |
95.58 - 95.74 |
1.0204 times |
Tue 14 October 2025 |
94.09 (0.33%) |
91.96 |
91.96 - 94.30 |
0.1458 times |
Mon 13 October 2025 |
93.78 (2.91%) |
93.95 |
93.67 - 94.40 |
2.478 times |
Fri 10 October 2025 |
91.13 (-3.85%) |
99.06 |
91.13 - 99.06 |
0.7653 times |
Thu 09 October 2025 |
94.78 (-0.61%) |
94.82 |
94.78 - 94.82 |
0.1822 times |
Weekly price and charts SpinfGuggenheim Strong weekly Stock price targets for SpinfGuggenheim CSD are 95.79 and 103.83 | Weekly Target 1 | 90.11 | | Weekly Target 2 | 93.42 | | Weekly Target 3 | 98.153333333333 | | Weekly Target 4 | 101.46 | | Weekly Target 5 | 106.19 |
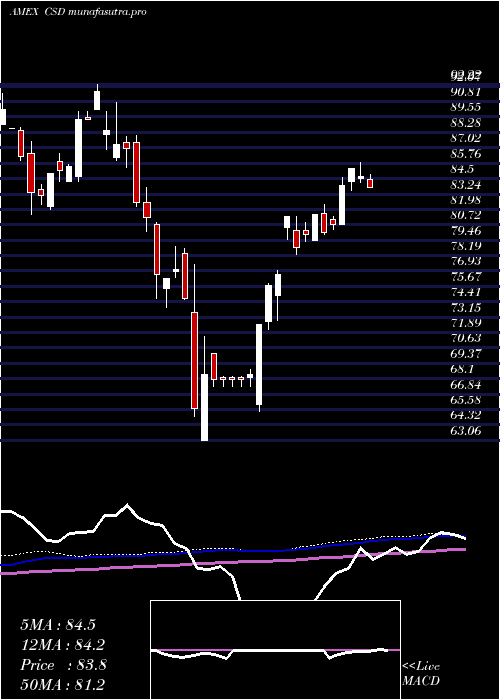
Weekly price and volumes for Spinf Guggenheim
| Date |
Closing |
Open |
Range |
Volume |
Thu 23 October 2025 |
96.72 (2.37%) |
95.79 |
94.85 - 102.89 |
2.3635 times |
Fri 17 October 2025 |
94.48 (3.68%) |
93.95 |
91.96 - 96.23 |
1.5673 times |
Fri 10 October 2025 |
91.13 (-4.09%) |
96.04 |
91.13 - 99.06 |
0.6205 times |
Fri 03 October 2025 |
95.02 (4.44%) |
92.18 |
92.17 - 95.20 |
0.5472 times |
Fri 26 September 2025 |
90.98 (-1.73%) |
92.50 |
90.07 - 94.11 |
0.667 times |
Fri 19 September 2025 |
92.58 (0.84%) |
91.91 |
91.91 - 95.29 |
0.6515 times |
Fri 12 September 2025 |
91.81 (2.46%) |
89.81 |
89.60 - 92.74 |
1.6442 times |
Fri 05 September 2025 |
89.61 (1.59%) |
86.34 |
86.34 - 90.09 |
0.729 times |
Fri 29 August 2025 |
88.21 (0%) |
87.94 |
87.93 - 88.21 |
0.2172 times |
Fri 29 August 2025 |
88.21 (-0.43%) |
88.73 |
87.93 - 92.05 |
0.9927 times |
Fri 22 August 2025 |
88.59 (2.29%) |
86.76 |
86.17 - 88.68 |
0.3257 times |
Monthly price and charts SpinfGuggenheim Strong monthly Stock price targets for SpinfGuggenheim CSD are 93.93 and 105.69 | Monthly Target 1 | 85.15 | | Monthly Target 2 | 90.94 | | Monthly Target 3 | 96.913333333333 | | Monthly Target 4 | 102.7 | | Monthly Target 5 | 108.67 |
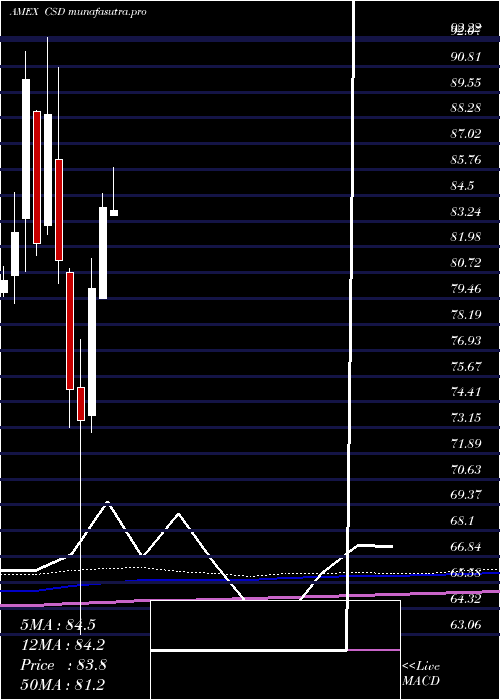
Monthly price and volumes Spinf Guggenheim
| Date |
Closing |
Open |
Range |
Volume |
Thu 23 October 2025 |
96.72 (3.87%) |
93.70 |
91.13 - 102.89 |
0.4509 times |
Tue 30 September 2025 |
93.12 (5.57%) |
86.34 |
86.34 - 95.29 |
0.3585 times |
Fri 29 August 2025 |
88.21 (2.14%) |
85.03 |
84.12 - 92.05 |
1.044 times |
Thu 31 July 2025 |
86.36 (2.93%) |
83.51 |
82.99 - 88.76 |
1.1045 times |
Mon 30 June 2025 |
83.90 (4.95%) |
79.44 |
79.44 - 84.60 |
0.3485 times |
Fri 30 May 2025 |
79.94 (8.78%) |
73.76 |
72.89 - 81.43 |
0.5984 times |
Wed 30 April 2025 |
73.49 (-2.04%) |
75.13 |
63.06 - 77.44 |
1.0283 times |
Mon 31 March 2025 |
75.02 (-7.75%) |
80.73 |
73.17 - 80.91 |
0.6341 times |
Fri 28 February 2025 |
81.32 (-8.08%) |
86.23 |
80.17 - 90.73 |
3.4149 times |
Fri 31 January 2025 |
88.47 (7.68%) |
83.03 |
82.58 - 92.22 |
1.0179 times |
Tue 31 December 2024 |
82.16 (-8.88%) |
88.61 |
81.58 - 88.66 |
2.5667 times |
DMA SMA EMA moving averages of Spinf Guggenheim CSD
DMA (daily moving average) of Spinf Guggenheim CSD
| DMA period | DMA value | | 5 day DMA | 95.67 | | 12 day DMA | 94.83 | | 20 day DMA | 94.31 | | 35 day DMA | 93.17 | | 50 day DMA | 91.57 | | 100 day DMA | 87.87 | | 150 day DMA | 83.29 | | 200 day DMA | 83.5 | EMA (exponential moving average) of Spinf Guggenheim CSD
| EMA period | EMA current | EMA prev | EMA prev2 | | 5 day EMA | 95.77 | 95.3 | 95.34 | | 12 day EMA | 95.02 | 94.71 | 94.62 | | 20 day EMA | 94.32 | 94.07 | 93.95 | | 35 day EMA | 92.96 | 92.74 | 92.59 | | 50 day EMA | 91.63 | 91.42 | 91.26 |
SMA (simple moving average) of Spinf Guggenheim CSD
| SMA period | SMA current | SMA prev | SMA prev2 | | 5 day SMA | 95.67 | 95.31 | 95.38 | | 12 day SMA | 94.83 | 94.57 | 94.54 | | 20 day SMA | 94.31 | 93.98 | 93.81 | | 35 day SMA | 93.17 | 92.94 | 92.7 | | 50 day SMA | 91.57 | 91.39 | 91.26 | | 100 day SMA | 87.87 | 87.7 | 87.55 | | 150 day SMA | 83.29 | 83.16 | 83.05 | | 200 day SMA | 83.5 | 83.45 | 83.4 |
|
|
