CoreUs CRED full analysis,charts,indicators,moving averages,SMA,DMA,EMA,ADX,MACD,RSICore Us CRED WideScreen charts, DMA,SMA,EMA technical analysis, forecast prediction, by indicators ADX,MACD,RSI,CCI AMEX stock exchange
Daily price and charts and targets CoreUs Strong Daily Stock price targets for CoreUs CRED are 21.47 and 21.47 | Daily Target 1 | 21.44 | | Daily Target 2 | 21.44 | | Daily Target 3 | 21.486666666667 | | Daily Target 4 | 21.49 | | Daily Target 5 | 21.49 |
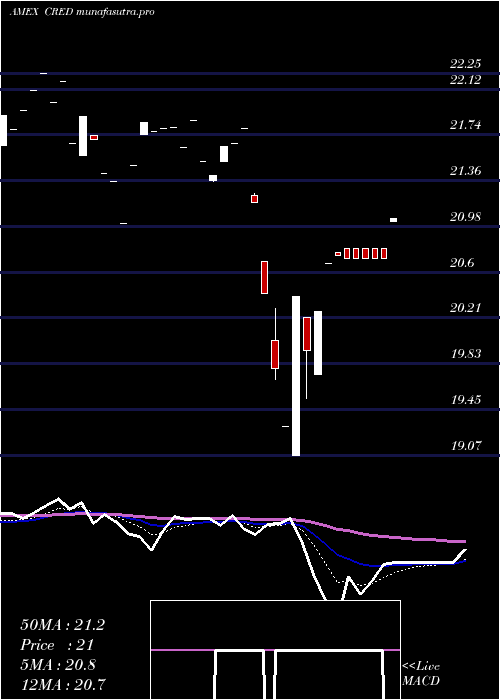
Daily price and volume Core Us
| Date |
Closing |
Open |
Range |
Volume |
Thu 23 October 2025 |
21.40 (0%) |
21.53 |
21.53 - 21.53 |
0 times |
Wed 22 October 2025 |
21.40 (-0.47%) |
21.55 |
21.55 - 21.55 |
0 times |
Tue 21 October 2025 |
21.50 (0.47%) |
21.50 |
21.50 - 21.50 |
0.5 times |
Mon 20 October 2025 |
21.40 (0%) |
21.41 |
21.40 - 21.41 |
1 times |
Fri 17 October 2025 |
21.40 (0.38%) |
21.40 |
21.40 - 21.40 |
0 times |
Thu 16 October 2025 |
21.32 (-0.05%) |
21.32 |
21.32 - 21.32 |
0 times |
Wed 15 October 2025 |
21.33 (0.76%) |
21.33 |
21.33 - 21.33 |
0.5 times |
Tue 14 October 2025 |
21.17 (0.76%) |
21.05 |
21.05 - 21.17 |
7 times |
Mon 13 October 2025 |
21.01 (0.33%) |
21.01 |
21.01 - 21.01 |
0.5 times |
Fri 10 October 2025 |
20.94 (-0.95%) |
20.94 |
20.94 - 20.94 |
0.5 times |
Thu 09 October 2025 |
21.14 (-0.24%) |
21.14 |
21.14 - 21.14 |
0.5 times |
Weekly price and charts CoreUs Strong weekly Stock price targets for CoreUs CRED are 21.33 and 21.48 | Weekly Target 1 | 21.3 | | Weekly Target 2 | 21.35 | | Weekly Target 3 | 21.45 | | Weekly Target 4 | 21.5 | | Weekly Target 5 | 21.6 |
Weekly price and volumes for Core Us
| Date |
Closing |
Open |
Range |
Volume |
Thu 23 October 2025 |
21.40 (0%) |
21.41 |
21.40 - 21.55 |
0.3659 times |
Fri 17 October 2025 |
21.40 (2.2%) |
21.01 |
21.01 - 21.40 |
1.9512 times |
Fri 10 October 2025 |
20.94 (-2.65%) |
21.28 |
20.94 - 21.28 |
0.4878 times |
Fri 03 October 2025 |
21.51 (0.42%) |
21.39 |
21.39 - 21.52 |
0.3659 times |
Fri 26 September 2025 |
21.42 (-0.6%) |
21.53 |
21.20 - 21.68 |
2.1951 times |
Fri 19 September 2025 |
21.55 (-1.01%) |
21.70 |
21.55 - 21.72 |
1.2195 times |
Fri 12 September 2025 |
21.77 (0.51%) |
21.49 |
21.49 - 21.85 |
0.6098 times |
Fri 05 September 2025 |
21.66 (-0.41%) |
22.32 |
21.32 - 22.32 |
1.3415 times |
Fri 29 August 2025 |
21.75 (0%) |
21.75 |
21.75 - 21.75 |
0.122 times |
Fri 29 August 2025 |
21.75 (-0.32%) |
21.65 |
21.56 - 21.75 |
1.3415 times |
Fri 22 August 2025 |
21.82 (2.63%) |
21.24 |
21.07 - 21.84 |
1.7073 times |

Monthly price and charts CoreUs Strong monthly Stock price targets for CoreUs CRED are 20.87 and 21.48 | Monthly Target 1 | 20.69 | | Monthly Target 2 | 21.04 | | Monthly Target 3 | 21.296666666667 | | Monthly Target 4 | 21.65 | | Monthly Target 5 | 21.91 |
Monthly price and volumes Core Us
| Date |
Closing |
Open |
Range |
Volume |
Thu 23 October 2025 |
21.40 (-0.51%) |
21.52 |
20.94 - 21.55 |
0.4408 times |
Tue 30 September 2025 |
21.51 (-1.1%) |
22.32 |
21.20 - 22.32 |
0.8448 times |
Fri 29 August 2025 |
21.75 (2.5%) |
21.18 |
21.01 - 21.84 |
1.1938 times |
Thu 31 July 2025 |
21.22 (-0.79%) |
21.63 |
21.22 - 22.15 |
1.1108 times |
Mon 30 June 2025 |
21.39 (-1.34%) |
21.67 |
21.04 - 22.04 |
2.0019 times |
Fri 30 May 2025 |
21.68 (0.74%) |
21.55 |
21.13 - 21.85 |
1.1754 times |
Wed 30 April 2025 |
21.52 (-0.55%) |
21.67 |
19.07 - 21.79 |
0.9198 times |
Mon 31 March 2025 |
21.64 (-2.13%) |
22.25 |
21.00 - 22.25 |
0.6834 times |
Fri 28 February 2025 |
22.11 (2.98%) |
21.39 |
21.39 - 22.11 |
0.6061 times |
Fri 31 January 2025 |
21.47 (-0.74%) |
21.43 |
20.69 - 22.54 |
1.0232 times |
Tue 31 December 2024 |
21.63 (-10.06%) |
23.88 |
21.14 - 23.88 |
1.7095 times |

DMA SMA EMA moving averages of Core Us CRED
DMA (daily moving average) of Core Us CRED
| DMA period | DMA value | | 5 day DMA | 21.42 | | 12 day DMA | 21.27 | | 20 day DMA | 21.32 | | 35 day DMA | 21.43 | | 50 day DMA | 21.46 | | 100 day DMA | 21.53 | | 150 day DMA | 21.41 | | 200 day DMA | 21.46 | EMA (exponential moving average) of Core Us CRED
| EMA period | EMA current | EMA prev | EMA prev2 | | 5 day EMA | 21.39 | 21.39 | 21.39 | | 12 day EMA | 21.35 | 21.34 | 21.33 | | 20 day EMA | 21.35 | 21.35 | 21.35 | | 35 day EMA | 21.37 | 21.37 | 21.37 | | 50 day EMA | 21.43 | 21.43 | 21.43 |
SMA (simple moving average) of Core Us CRED
| SMA period | SMA current | SMA prev | SMA prev2 | | 5 day SMA | 21.42 | 21.4 | 21.39 | | 12 day SMA | 21.27 | 21.25 | 21.24 | | 20 day SMA | 21.32 | 21.31 | 21.31 | | 35 day SMA | 21.43 | 21.43 | 21.43 | | 50 day SMA | 21.46 | 21.45 | 21.45 | | 100 day SMA | 21.53 | 21.54 | 21.54 | | 150 day SMA | 21.41 | 21.42 | 21.42 | | 200 day SMA | 21.46 | 21.46 | 21.46 |
|
|
