ChinaTechnology CQQQ full analysis,charts,indicators,moving averages,SMA,DMA,EMA,ADX,MACD,RSIChina Technology CQQQ WideScreen charts, DMA,SMA,EMA technical analysis, forecast prediction, by indicators ADX,MACD,RSI,CCI AMEX stock exchange
Daily price and charts and targets ChinaTechnology Strong Daily Stock price targets for ChinaTechnology CQQQ are 56 and 57.5 | Daily Target 1 | 54.83 | | Daily Target 2 | 55.66 | | Daily Target 3 | 56.33 | | Daily Target 4 | 57.16 | | Daily Target 5 | 57.83 |
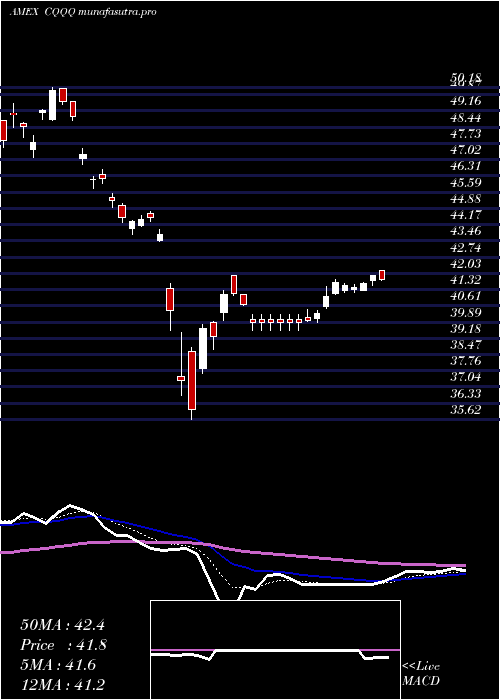
Daily price and volume China Technology
| Date |
Closing |
Open |
Range |
Volume |
Fri 24 October 2025 |
56.49 (2.21%) |
55.50 |
55.50 - 57.00 |
0.9843 times |
Thu 23 October 2025 |
55.27 (1.36%) |
54.81 |
54.72 - 55.48 |
0.2998 times |
Wed 22 October 2025 |
54.53 (-0.89%) |
54.61 |
54.13 - 55.08 |
0.2513 times |
Tue 21 October 2025 |
55.02 (0%) |
55.27 |
54.86 - 55.27 |
0.3337 times |
Mon 20 October 2025 |
55.02 (1.25%) |
54.51 |
54.22 - 55.13 |
0.708 times |
Fri 17 October 2025 |
54.34 (-1.79%) |
52.71 |
52.70 - 54.58 |
1.4494 times |
Thu 16 October 2025 |
55.33 (-0.4%) |
55.60 |
55.00 - 56.00 |
0.9715 times |
Wed 15 October 2025 |
55.55 (1.09%) |
55.91 |
55.18 - 56.01 |
1.101 times |
Tue 14 October 2025 |
54.95 (-2.93%) |
54.31 |
54.26 - 55.39 |
3.0513 times |
Mon 13 October 2025 |
56.61 (4.31%) |
56.80 |
56.45 - 57.01 |
0.8497 times |
Fri 10 October 2025 |
54.27 (-7.8%) |
57.46 |
53.92 - 58.00 |
5.3077 times |
Weekly price and charts ChinaTechnology Strong weekly Stock price targets for ChinaTechnology CQQQ are 55.31 and 58.18 | Weekly Target 1 | 53 | | Weekly Target 2 | 54.75 | | Weekly Target 3 | 55.873333333333 | | Weekly Target 4 | 57.62 | | Weekly Target 5 | 58.74 |
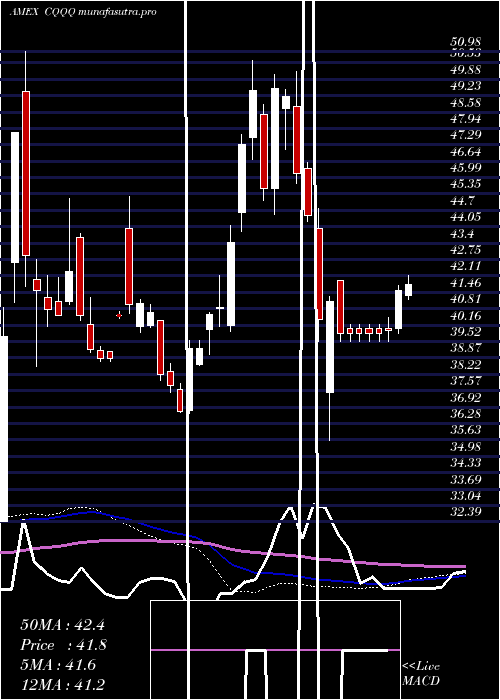
Weekly price and volumes for China Technology
| Date |
Closing |
Open |
Range |
Volume |
Fri 24 October 2025 |
56.49 (3.96%) |
54.51 |
54.13 - 57.00 |
0.5288 times |
Fri 17 October 2025 |
54.34 (0.13%) |
56.80 |
52.70 - 57.01 |
1.5231 times |
Fri 10 October 2025 |
54.27 (-9.91%) |
60.00 |
53.92 - 61.80 |
1.9581 times |
Fri 03 October 2025 |
60.24 (5.5%) |
58.40 |
58.13 - 61.32 |
1.111 times |
Fri 26 September 2025 |
57.10 (0.42%) |
57.53 |
56.24 - 58.46 |
2.0502 times |
Fri 19 September 2025 |
56.86 (3.97%) |
55.22 |
54.91 - 57.81 |
0.6917 times |
Fri 12 September 2025 |
54.69 (5.82%) |
52.24 |
51.82 - 55.02 |
0.6216 times |
Fri 05 September 2025 |
51.68 (-3.42%) |
51.70 |
49.77 - 52.41 |
0.6598 times |
Fri 29 August 2025 |
53.51 (0%) |
53.78 |
53.25 - 53.78 |
0.1318 times |
Fri 29 August 2025 |
53.51 (2.29%) |
52.58 |
51.43 - 53.80 |
0.7238 times |
Fri 22 August 2025 |
52.31 (6.69%) |
49.55 |
48.88 - 52.44 |
0.2728 times |
Monthly price and charts ChinaTechnology Strong monthly Stock price targets for ChinaTechnology CQQQ are 50.05 and 59.15 | Monthly Target 1 | 47.9 | | Monthly Target 2 | 52.19 | | Monthly Target 3 | 56.996666666667 | | Monthly Target 4 | 61.29 | | Monthly Target 5 | 66.1 |
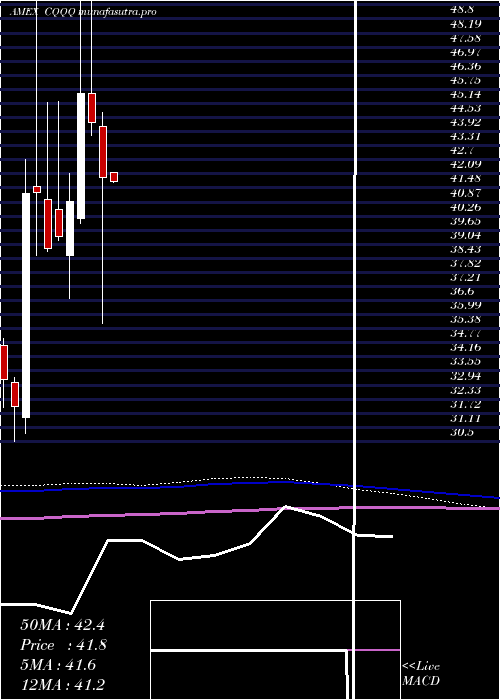
Monthly price and volumes China Technology
| Date |
Closing |
Open |
Range |
Volume |
Fri 24 October 2025 |
56.49 (-4.27%) |
59.13 |
52.70 - 61.80 |
2.2117 times |
Tue 30 September 2025 |
59.01 (10.28%) |
51.70 |
49.77 - 59.70 |
2.1938 times |
Fri 29 August 2025 |
53.51 (14.34%) |
46.10 |
45.65 - 53.80 |
0.8113 times |
Thu 31 July 2025 |
46.80 (5.76%) |
44.18 |
43.04 - 47.80 |
0.8164 times |
Mon 30 June 2025 |
44.25 (8.88%) |
40.74 |
40.53 - 44.27 |
0.4158 times |
Fri 30 May 2025 |
40.64 (-3.1%) |
42.14 |
40.39 - 44.70 |
0.4959 times |
Wed 30 April 2025 |
41.94 (-5.35%) |
44.15 |
35.62 - 44.76 |
0.8022 times |
Mon 31 March 2025 |
44.31 (-2.79%) |
45.57 |
43.75 - 50.18 |
0.9018 times |
Fri 28 February 2025 |
45.58 (11.5%) |
40.16 |
39.93 - 50.62 |
1.1123 times |
Fri 31 January 2025 |
40.88 (3.81%) |
38.56 |
36.67 - 42.11 |
0.2389 times |
Tue 31 December 2024 |
39.38 (1.39%) |
40.55 |
39.19 - 45.23 |
0.2004 times |
DMA SMA EMA moving averages of China Technology CQQQ
DMA (daily moving average) of China Technology CQQQ
| DMA period | DMA value | | 5 day DMA | 55.27 | | 12 day DMA | 55.52 | | 20 day DMA | 57.18 | | 35 day DMA | 56.56 | | 50 day DMA | 55.06 | | 100 day DMA | 50.06 | | 150 day DMA | 47.29 | | 200 day DMA | 46.61 | EMA (exponential moving average) of China Technology CQQQ
| EMA period | EMA current | EMA prev | EMA prev2 | | 5 day EMA | 55.54 | 55.07 | 54.97 | | 12 day EMA | 55.86 | 55.75 | 55.84 | | 20 day EMA | 56.1 | 56.06 | 56.14 | | 35 day EMA | 55.42 | 55.36 | 55.37 | | 50 day EMA | 54.52 | 54.44 | 54.41 |
SMA (simple moving average) of China Technology CQQQ
| SMA period | SMA current | SMA prev | SMA prev2 | | 5 day SMA | 55.27 | 54.84 | 54.85 | | 12 day SMA | 55.52 | 55.79 | 56.15 | | 20 day SMA | 57.18 | 57.21 | 57.36 | | 35 day SMA | 56.56 | 56.42 | 56.27 | | 50 day SMA | 55.06 | 54.91 | 54.76 | | 100 day SMA | 50.06 | 49.9 | 49.75 | | 150 day SMA | 47.29 | 47.22 | 47.16 | | 200 day SMA | 46.61 | 46.51 | 46.43 |
|
|
