ChinaPharma CPHI full analysis,charts,indicators,moving averages,SMA,DMA,EMA,ADX,MACD,RSIChina Pharma CPHI WideScreen charts, DMA,SMA,EMA technical analysis, forecast prediction, by indicators ADX,MACD,RSI,CCI AMEX stock exchange
Daily price and charts and targets ChinaPharma Strong Daily Stock price targets for ChinaPharma CPHI are 1.77 and 1.89 | Daily Target 1 | 1.67 | | Daily Target 2 | 1.75 | | Daily Target 3 | 1.7933333333333 | | Daily Target 4 | 1.87 | | Daily Target 5 | 1.91 |
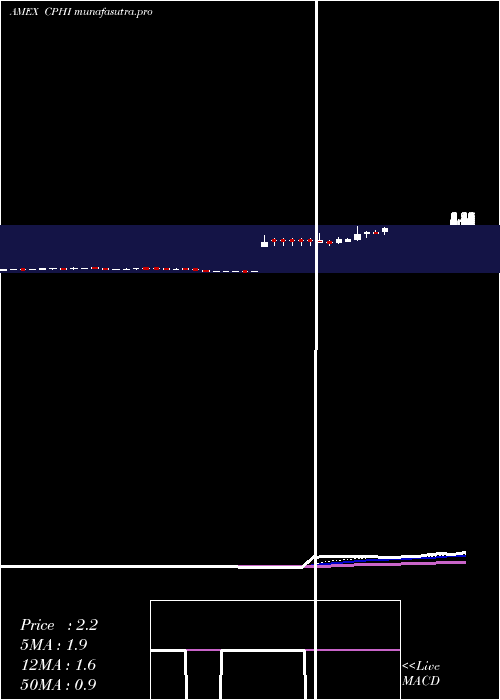
Daily price and volume China Pharma
| Date |
Closing |
Open |
Range |
Volume |
Fri 24 October 2025 |
1.82 (6.43%) |
1.72 |
1.72 - 1.84 |
1.4865 times |
Thu 23 October 2025 |
1.71 (1.79%) |
1.69 |
1.69 - 1.76 |
0.0892 times |
Wed 22 October 2025 |
1.68 (-6.15%) |
1.76 |
1.64 - 1.77 |
2.9737 times |
Tue 21 October 2025 |
1.79 (-0.56%) |
1.82 |
1.79 - 1.82 |
0.3893 times |
Mon 20 October 2025 |
1.80 (-1.1%) |
1.82 |
1.80 - 1.85 |
0.8266 times |
Fri 17 October 2025 |
1.82 (-3.19%) |
1.85 |
1.81 - 1.86 |
0.5324 times |
Thu 16 October 2025 |
1.88 (-1.05%) |
1.90 |
1.80 - 1.93 |
1.1332 times |
Wed 15 October 2025 |
1.90 (1.6%) |
1.81 |
1.81 - 1.91 |
0.6228 times |
Tue 14 October 2025 |
1.87 (0.54%) |
1.86 |
1.83 - 1.87 |
0.8252 times |
Mon 13 October 2025 |
1.86 (2.2%) |
1.82 |
1.81 - 1.86 |
1.1211 times |
Fri 10 October 2025 |
1.82 (-5.7%) |
1.97 |
1.80 - 2.00 |
4.5933 times |
Weekly price and charts ChinaPharma Strong weekly Stock price targets for ChinaPharma CPHI are 1.72 and 1.93 | Weekly Target 1 | 1.56 | | Weekly Target 2 | 1.69 | | Weekly Target 3 | 1.77 | | Weekly Target 4 | 1.9 | | Weekly Target 5 | 1.98 |
Weekly price and volumes for China Pharma
| Date |
Closing |
Open |
Range |
Volume |
Fri 24 October 2025 |
1.82 (0%) |
1.82 |
1.64 - 1.85 |
0.244 times |
Fri 17 October 2025 |
1.82 (0%) |
1.82 |
1.80 - 1.93 |
0.1793 times |
Fri 10 October 2025 |
1.82 (-3.7%) |
1.89 |
1.80 - 2.00 |
0.8015 times |
Fri 03 October 2025 |
1.89 (1.07%) |
1.95 |
1.75 - 1.97 |
0.5299 times |
Fri 26 September 2025 |
1.87 (-6.03%) |
1.89 |
1.85 - 2.00 |
0.4251 times |
Fri 19 September 2025 |
1.99 (9.34%) |
1.87 |
1.77 - 1.99 |
0.8318 times |
Fri 12 September 2025 |
1.82 (8.98%) |
1.64 |
1.59 - 2.03 |
5.2675 times |
Fri 05 September 2025 |
1.67 (20.14%) |
1.40 |
1.40 - 1.68 |
0.7514 times |
Fri 29 August 2025 |
1.39 (0%) |
1.42 |
1.34 - 1.48 |
0.1002 times |
Fri 29 August 2025 |
1.39 (-5.44%) |
1.48 |
1.34 - 1.53 |
0.8694 times |
Fri 22 August 2025 |
1.47 (2.8%) |
1.51 |
1.35 - 1.54 |
0.3915 times |

Monthly price and charts ChinaPharma Strong monthly Stock price targets for ChinaPharma CPHI are 1.73 and 2.09 | Monthly Target 1 | 1.46 | | Monthly Target 2 | 1.64 | | Monthly Target 3 | 1.82 | | Monthly Target 4 | 2 | | Monthly Target 5 | 2.18 |
Monthly price and volumes China Pharma
| Date |
Closing |
Open |
Range |
Volume |
Fri 24 October 2025 |
1.82 (-6.67%) |
1.80 |
1.64 - 2.00 |
0.0263 times |
Tue 30 September 2025 |
1.95 (40.29%) |
1.40 |
1.40 - 2.03 |
0.1408 times |
Fri 29 August 2025 |
1.39 (-18.71%) |
1.71 |
1.29 - 1.71 |
0.1275 times |
Thu 31 July 2025 |
1.71 (-4.47%) |
1.77 |
1.62 - 1.94 |
0.2216 times |
Mon 30 June 2025 |
1.79 (11.88%) |
1.69 |
1.46 - 2.05 |
0.2142 times |
Fri 30 May 2025 |
1.60 (-25.58%) |
2.10 |
1.56 - 2.60 |
0.1549 times |
Wed 30 April 2025 |
2.15 (726.92%) |
0.26 |
0.12 - 2.22 |
0.8425 times |
Mon 31 March 2025 |
0.26 (23.81%) |
0.20 |
0.18 - 0.32 |
1.3789 times |
Fri 28 February 2025 |
0.21 (-4.55%) |
0.21 |
0.18 - 0.27 |
2.6285 times |
Fri 31 January 2025 |
0.22 (-4.35%) |
0.21 |
0.18 - 0.34 |
4.2648 times |
Tue 31 December 2024 |
0.23 (15%) |
0.20 |
0.13 - 0.26 |
1.9667 times |

DMA SMA EMA moving averages of China Pharma CPHI
DMA (daily moving average) of China Pharma CPHI
| DMA period | DMA value | | 5 day DMA | 1.76 | | 12 day DMA | 1.82 | | 20 day DMA | 1.87 | | 35 day DMA | 1.88 | | 50 day DMA | 1.75 | | 100 day DMA | 1.72 | | 150 day DMA | 1.62 | | 200 day DMA | 1.27 | EMA (exponential moving average) of China Pharma CPHI
| EMA period | EMA current | EMA prev | EMA prev2 | | 5 day EMA | 1.78 | 1.76 | 1.78 | | 12 day EMA | 1.82 | 1.82 | 1.84 | | 20 day EMA | 1.82 | 1.82 | 1.83 | | 35 day EMA | 1.79 | 1.79 | 1.79 | | 50 day EMA | 1.72 | 1.72 | 1.72 |
SMA (simple moving average) of China Pharma CPHI
| SMA period | SMA current | SMA prev | SMA prev2 | | 5 day SMA | 1.76 | 1.76 | 1.79 | | 12 day SMA | 1.82 | 1.84 | 1.86 | | 20 day SMA | 1.87 | 1.87 | 1.89 | | 35 day SMA | 1.88 | 1.88 | 1.87 | | 50 day SMA | 1.75 | 1.74 | 1.74 | | 100 day SMA | 1.72 | 1.72 | 1.72 | | 150 day SMA | 1.62 | 1.61 | 1.6 | | 200 day SMA | 1.27 | 1.27 | 1.26 |
|
|
