UsCopper CPER full analysis,charts,indicators,moving averages,SMA,DMA,EMA,ADX,MACD,RSIUs Copper CPER WideScreen charts, DMA,SMA,EMA technical analysis, forecast prediction, by indicators ADX,MACD,RSI,CCI AMEX stock exchange
Daily price and charts and targets UsCopper Strong Daily Stock price targets for UsCopper CPER are 31.49 and 31.95 | Daily Target 1 | 31.13 | | Daily Target 2 | 31.38 | | Daily Target 3 | 31.59 | | Daily Target 4 | 31.84 | | Daily Target 5 | 32.05 |
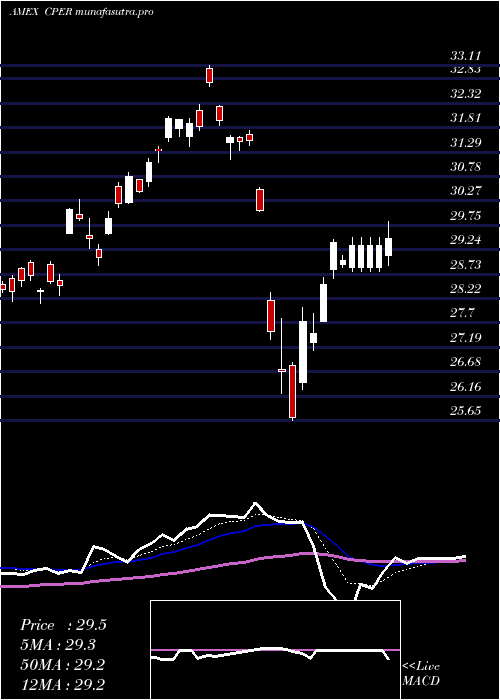
Daily price and volume Us Copper
| Date |
Closing |
Open |
Range |
Volume |
Fri 24 October 2025 |
31.63 (0.64%) |
31.57 |
31.34 - 31.80 |
0.7166 times |
Thu 23 October 2025 |
31.43 (1.49%) |
31.25 |
31.00 - 31.63 |
0.8126 times |
Wed 22 October 2025 |
30.97 (1.41%) |
30.55 |
30.54 - 31.00 |
0.6032 times |
Tue 21 October 2025 |
30.54 (-2.24%) |
30.79 |
30.41 - 30.82 |
1.036 times |
Mon 20 October 2025 |
31.24 (1.36%) |
31.00 |
30.75 - 31.28 |
0.709 times |
Fri 17 October 2025 |
30.82 (-0.06%) |
30.53 |
30.24 - 30.89 |
0.6892 times |
Thu 16 October 2025 |
30.84 (0.33%) |
30.66 |
30.59 - 30.99 |
0.9233 times |
Wed 15 October 2025 |
30.74 (-0.36%) |
31.06 |
30.56 - 31.08 |
1.2636 times |
Tue 14 October 2025 |
30.85 (-2.34%) |
30.73 |
30.60 - 31.10 |
2.1268 times |
Mon 13 October 2025 |
31.59 (4.36%) |
31.63 |
31.47 - 31.93 |
1.1195 times |
Fri 10 October 2025 |
30.27 (-4.42%) |
31.91 |
30.01 - 31.91 |
2.9635 times |
Weekly price and charts UsCopper Strong weekly Stock price targets for UsCopper CPER are 31.02 and 32.41 | Weekly Target 1 | 29.89 | | Weekly Target 2 | 30.76 | | Weekly Target 3 | 31.28 | | Weekly Target 4 | 32.15 | | Weekly Target 5 | 32.67 |
Weekly price and volumes for Us Copper
| Date |
Closing |
Open |
Range |
Volume |
Fri 24 October 2025 |
31.63 (2.63%) |
31.00 |
30.41 - 31.80 |
1.034 times |
Fri 17 October 2025 |
30.82 (1.82%) |
31.63 |
30.24 - 31.93 |
1.6326 times |
Fri 10 October 2025 |
30.27 (-3.35%) |
31.20 |
30.01 - 32.40 |
2.0333 times |
Fri 03 October 2025 |
31.32 (6.64%) |
29.76 |
29.72 - 31.63 |
1.6603 times |
Fri 26 September 2025 |
29.37 (2.76%) |
28.47 |
28.37 - 29.85 |
1.3592 times |
Fri 19 September 2025 |
28.58 (-0.07%) |
28.74 |
28.20 - 29.07 |
0.4704 times |
Fri 12 September 2025 |
28.60 (2.36%) |
27.97 |
27.95 - 28.80 |
0.8272 times |
Fri 05 September 2025 |
27.94 (-0.68%) |
28.08 |
27.85 - 28.57 |
0.4052 times |
Fri 29 August 2025 |
28.13 (0%) |
28.02 |
27.93 - 28.22 |
0.1229 times |
Fri 29 August 2025 |
28.13 (1.3%) |
27.87 |
27.37 - 28.22 |
0.4548 times |
Fri 22 August 2025 |
27.77 (-0.54%) |
27.83 |
27.52 - 27.94 |
0.85 times |

Monthly price and charts UsCopper Strong monthly Stock price targets for UsCopper CPER are 30.72 and 33.32 | Monthly Target 1 | 28.68 | | Monthly Target 2 | 30.15 | | Monthly Target 3 | 31.276666666667 | | Monthly Target 4 | 32.75 | | Monthly Target 5 | 33.88 |
Monthly price and volumes Us Copper
| Date |
Closing |
Open |
Range |
Volume |
Fri 24 October 2025 |
31.63 (5.43%) |
29.87 |
29.80 - 32.40 |
1.8024 times |
Tue 30 September 2025 |
30.00 (6.65%) |
28.08 |
27.85 - 30.34 |
1.3421 times |
Fri 29 August 2025 |
28.13 (2.48%) |
27.50 |
27.16 - 28.22 |
1.172 times |
Thu 31 July 2025 |
27.45 (-13.24%) |
32.00 |
27.08 - 36.69 |
2.0541 times |
Mon 30 June 2025 |
31.64 (7.77%) |
30.44 |
29.69 - 31.92 |
0.6263 times |
Fri 30 May 2025 |
29.36 (2.87%) |
28.91 |
28.45 - 30.50 |
0.5585 times |
Wed 30 April 2025 |
28.54 (-9.68%) |
31.60 |
25.65 - 31.74 |
0.8023 times |
Mon 31 March 2025 |
31.60 (11.35%) |
28.93 |
28.27 - 33.11 |
0.7341 times |
Fri 28 February 2025 |
28.38 (5.7%) |
26.84 |
26.76 - 30.18 |
0.4568 times |
Fri 31 January 2025 |
26.85 (6.72%) |
25.16 |
25.12 - 27.80 |
0.4514 times |
Tue 31 December 2024 |
25.16 (-2.06%) |
26.26 |
25.10 - 26.76 |
0.2355 times |

DMA SMA EMA moving averages of Us Copper CPER
DMA (daily moving average) of Us Copper CPER
| DMA period | DMA value | | 5 day DMA | 31.16 | | 12 day DMA | 31.05 | | 20 day DMA | 30.94 | | 35 day DMA | 29.99 | | 50 day DMA | 29.38 | | 100 day DMA | 30.37 | | 150 day DMA | 30.08 | | 200 day DMA | 29.71 | EMA (exponential moving average) of Us Copper CPER
| EMA period | EMA current | EMA prev | EMA prev2 | | 5 day EMA | 31.26 | 31.07 | 30.89 | | 12 day EMA | 31.02 | 30.91 | 30.82 | | 20 day EMA | 30.72 | 30.62 | 30.54 | | 35 day EMA | 30.14 | 30.05 | 29.97 | | 50 day EMA | 29.44 | 29.35 | 29.26 |
SMA (simple moving average) of Us Copper CPER
| SMA period | SMA current | SMA prev | SMA prev2 | | 5 day SMA | 31.16 | 31 | 30.88 | | 12 day SMA | 31.05 | 31.03 | 31.02 | | 20 day SMA | 30.94 | 30.82 | 30.73 | | 35 day SMA | 29.99 | 29.89 | 29.79 | | 50 day SMA | 29.38 | 29.3 | 29.23 | | 100 day SMA | 30.37 | 30.36 | 30.34 | | 150 day SMA | 30.08 | 30.09 | 30.09 | | 200 day SMA | 29.71 | 29.68 | 29.65 |
|
|
