PacerUs COWZ full analysis,charts,indicators,moving averages,SMA,DMA,EMA,ADX,MACD,RSIPacer Us COWZ WideScreen charts, DMA,SMA,EMA technical analysis, forecast prediction, by indicators ADX,MACD,RSI,CCI AMEX stock exchange
Daily price and charts and targets PacerUs Strong Daily Stock price targets for PacerUs COWZ are 57.82 and 58.17 | Daily Target 1 | 57.54 | | Daily Target 2 | 57.74 | | Daily Target 3 | 57.893333333333 | | Daily Target 4 | 58.09 | | Daily Target 5 | 58.24 |
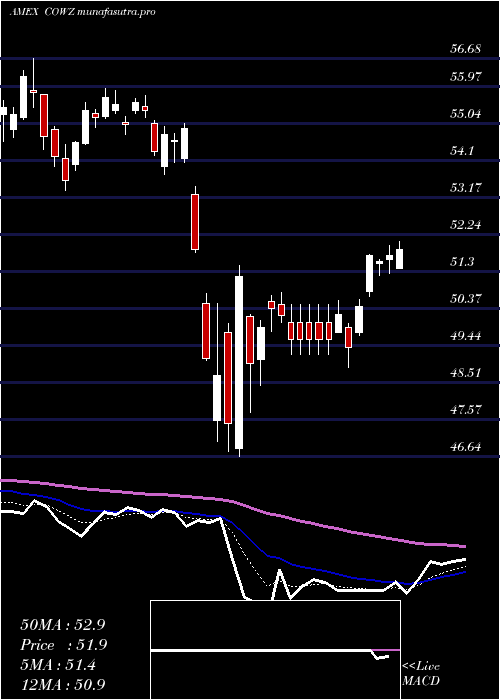
Daily price and volume Pacer Us
| Date |
Closing |
Open |
Range |
Volume |
Thu 23 October 2025 |
57.93 (0.45%) |
57.91 |
57.70 - 58.05 |
0.9258 times |
Wed 22 October 2025 |
57.67 (-0.36%) |
57.84 |
57.49 - 58.01 |
0.7957 times |
Tue 21 October 2025 |
57.88 (0.85%) |
57.40 |
57.33 - 57.96 |
0.962 times |
Mon 20 October 2025 |
57.39 (1.23%) |
56.97 |
56.92 - 57.48 |
1.1273 times |
Fri 17 October 2025 |
56.69 (0.51%) |
56.30 |
56.18 - 56.81 |
1.0319 times |
Thu 16 October 2025 |
56.40 (-0.74%) |
56.99 |
56.11 - 57.15 |
0.8138 times |
Wed 15 October 2025 |
56.82 (0.18%) |
57.04 |
56.40 - 57.29 |
0.8778 times |
Tue 14 October 2025 |
56.72 (0.73%) |
55.84 |
55.69 - 56.94 |
1.1829 times |
Mon 13 October 2025 |
56.31 (1.22%) |
56.12 |
56.01 - 56.43 |
0.8508 times |
Fri 10 October 2025 |
55.63 (-2.32%) |
56.98 |
55.62 - 57.05 |
1.4318 times |
Thu 09 October 2025 |
56.95 (-0.78%) |
57.47 |
56.87 - 57.55 |
1.0558 times |
Weekly price and charts PacerUs Strong weekly Stock price targets for PacerUs COWZ are 57.43 and 58.56 | Weekly Target 1 | 56.5 | | Weekly Target 2 | 57.22 | | Weekly Target 3 | 57.633333333333 | | Weekly Target 4 | 58.35 | | Weekly Target 5 | 58.76 |
Weekly price and volumes for Pacer Us
| Date |
Closing |
Open |
Range |
Volume |
Thu 23 October 2025 |
57.93 (2.19%) |
56.97 |
56.92 - 58.05 |
0.698 times |
Fri 17 October 2025 |
56.69 (1.91%) |
56.12 |
55.69 - 57.29 |
0.8713 times |
Fri 10 October 2025 |
55.63 (-3.79%) |
57.80 |
55.62 - 58.11 |
1.236 times |
Fri 03 October 2025 |
57.82 (0.5%) |
57.71 |
57.10 - 58.11 |
1.1999 times |
Fri 26 September 2025 |
57.53 (0.52%) |
57.10 |
56.79 - 57.82 |
1.414 times |
Fri 19 September 2025 |
57.23 (0.02%) |
57.31 |
56.89 - 57.89 |
1.4004 times |
Fri 12 September 2025 |
57.22 (-0.57%) |
57.55 |
56.94 - 57.94 |
1.453 times |
Fri 05 September 2025 |
57.55 (-0.96%) |
57.78 |
56.95 - 58.13 |
0.7116 times |
Fri 29 August 2025 |
58.11 (0%) |
57.92 |
57.89 - 58.28 |
0.1547 times |
Fri 29 August 2025 |
58.11 (0.1%) |
57.92 |
57.46 - 58.28 |
0.8613 times |
Fri 22 August 2025 |
58.05 (2.13%) |
56.80 |
56.65 - 58.18 |
0.9404 times |
Monthly price and charts PacerUs Strong monthly Stock price targets for PacerUs COWZ are 56.78 and 59.27 | Monthly Target 1 | 54.73 | | Monthly Target 2 | 56.33 | | Monthly Target 3 | 57.22 | | Monthly Target 4 | 58.82 | | Monthly Target 5 | 59.71 |
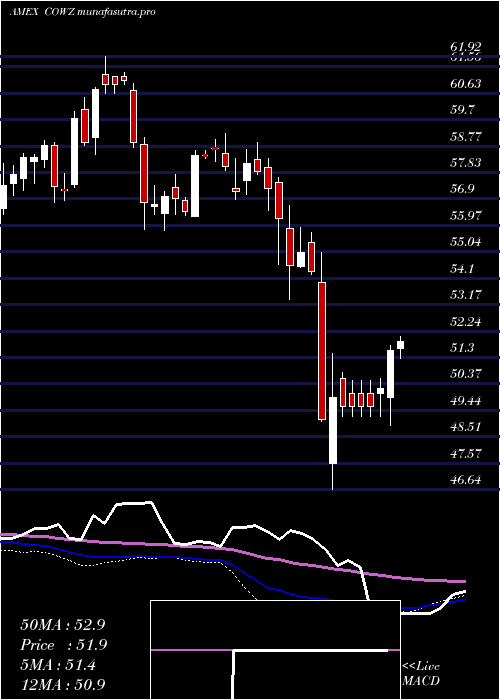
Monthly price and volumes Pacer Us
| Date |
Closing |
Open |
Range |
Volume |
Thu 23 October 2025 |
57.93 (0.8%) |
57.37 |
55.62 - 58.11 |
0.6597 times |
Tue 30 September 2025 |
57.47 (-1.1%) |
57.78 |
56.79 - 58.13 |
1.0435 times |
Fri 29 August 2025 |
58.11 (4.42%) |
55.44 |
54.82 - 58.28 |
0.7748 times |
Thu 31 July 2025 |
55.65 (1%) |
55.10 |
55.07 - 57.42 |
1.2006 times |
Mon 30 June 2025 |
55.10 (2.82%) |
53.67 |
53.07 - 55.49 |
1.1521 times |
Fri 30 May 2025 |
53.59 (3.36%) |
51.84 |
51.57 - 55.03 |
0.9584 times |
Wed 30 April 2025 |
51.85 (-5.31%) |
54.58 |
46.64 - 55.03 |
1.564 times |
Mon 31 March 2025 |
54.76 (-4.37%) |
57.47 |
53.35 - 57.65 |
0.9496 times |
Fri 28 February 2025 |
57.26 (-1.36%) |
57.27 |
56.50 - 58.89 |
0.8239 times |
Fri 31 January 2025 |
58.05 (2.78%) |
56.89 |
56.27 - 59.21 |
0.8735 times |
Tue 31 December 2024 |
56.48 (-7.3%) |
61.21 |
55.77 - 61.37 |
0.593 times |

DMA SMA EMA moving averages of Pacer Us COWZ
DMA (daily moving average) of Pacer Us COWZ
| DMA period | DMA value | | 5 day DMA | 57.51 | | 12 day DMA | 56.98 | | 20 day DMA | 57.25 | | 35 day DMA | 57.28 | | 50 day DMA | 57.36 | | 100 day DMA | 56.5 | | 150 day DMA | 55.08 | | 200 day DMA | 55.61 | EMA (exponential moving average) of Pacer Us COWZ
| EMA period | EMA current | EMA prev | EMA prev2 | | 5 day EMA | 57.56 | 57.37 | 57.22 | | 12 day EMA | 57.28 | 57.16 | 57.07 | | 20 day EMA | 57.23 | 57.16 | 57.11 | | 35 day EMA | 57.24 | 57.2 | 57.17 | | 50 day EMA | 57.29 | 57.26 | 57.24 |
SMA (simple moving average) of Pacer Us COWZ
| SMA period | SMA current | SMA prev | SMA prev2 | | 5 day SMA | 57.51 | 57.21 | 57.04 | | 12 day SMA | 56.98 | 56.94 | 56.96 | | 20 day SMA | 57.25 | 57.2 | 57.19 | | 35 day SMA | 57.28 | 57.27 | 57.27 | | 50 day SMA | 57.36 | 57.34 | 57.32 | | 100 day SMA | 56.5 | 56.45 | 56.42 | | 150 day SMA | 55.08 | 55.07 | 55.05 | | 200 day SMA | 55.61 | 55.61 | 55.61 |
|
|
