TeucriumCorn CORN full analysis,charts,indicators,moving averages,SMA,DMA,EMA,ADX,MACD,RSITeucrium Corn CORN WideScreen charts, DMA,SMA,EMA technical analysis, forecast prediction, by indicators ADX,MACD,RSI,CCI AMEX stock exchange
Daily price and charts and targets TeucriumCorn Strong Daily Stock price targets for TeucriumCorn CORN are 17.56 and 17.65 | Daily Target 1 | 17.54 | | Daily Target 2 | 17.58 | | Daily Target 3 | 17.63 | | Daily Target 4 | 17.67 | | Daily Target 5 | 17.72 |
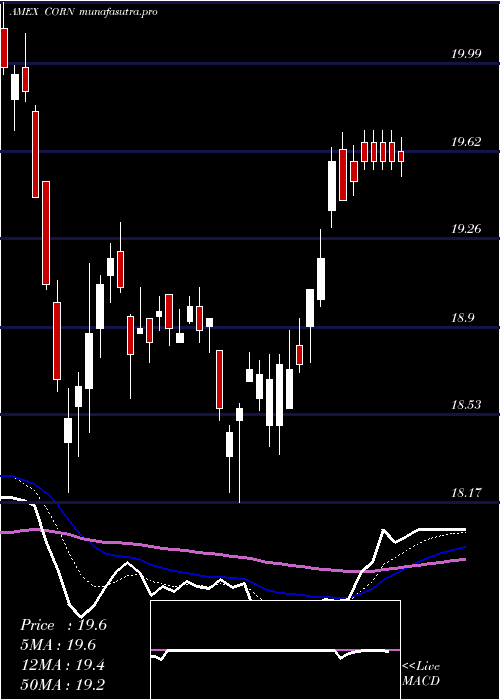
Daily price and volume Teucrium Corn
| Date |
Closing |
Open |
Range |
Volume |
Fri 24 October 2025 |
17.62 (-0.34%) |
17.67 |
17.59 - 17.68 |
1.4632 times |
Thu 23 October 2025 |
17.68 (1.03%) |
17.67 |
17.47 - 17.72 |
1.5416 times |
Wed 22 October 2025 |
17.50 (0.23%) |
17.50 |
17.44 - 17.56 |
1.37 times |
Tue 21 October 2025 |
17.46 (-0.57%) |
17.51 |
17.41 - 17.55 |
0.978 times |
Mon 20 October 2025 |
17.56 (0.11%) |
17.64 |
17.41 - 17.64 |
0.5476 times |
Fri 17 October 2025 |
17.54 (0.17%) |
17.51 |
17.51 - 17.65 |
0.4671 times |
Thu 16 October 2025 |
17.51 (0.52%) |
17.54 |
17.38 - 17.56 |
0.7598 times |
Wed 15 October 2025 |
17.42 (0.93%) |
17.26 |
17.23 - 17.45 |
0.652 times |
Tue 14 October 2025 |
17.26 (0.23%) |
17.19 |
17.19 - 17.30 |
0.9484 times |
Mon 13 October 2025 |
17.22 (-0.46%) |
17.27 |
17.22 - 17.32 |
1.2723 times |
Fri 10 October 2025 |
17.30 (-0.86%) |
17.41 |
17.26 - 17.41 |
1.8121 times |
Weekly price and charts TeucriumCorn Strong weekly Stock price targets for TeucriumCorn CORN are 17.36 and 17.67 | Weekly Target 1 | 17.27 | | Weekly Target 2 | 17.45 | | Weekly Target 3 | 17.583333333333 | | Weekly Target 4 | 17.76 | | Weekly Target 5 | 17.89 |
Weekly price and volumes for Teucrium Corn
| Date |
Closing |
Open |
Range |
Volume |
Fri 24 October 2025 |
17.62 (0.46%) |
17.64 |
17.41 - 17.72 |
0.9621 times |
Fri 17 October 2025 |
17.54 (1.39%) |
17.27 |
17.19 - 17.65 |
0.6685 times |
Fri 10 October 2025 |
17.30 (-1.76%) |
17.45 |
17.26 - 17.66 |
0.7088 times |
Fri 03 October 2025 |
17.61 (-0.06%) |
17.57 |
17.30 - 17.74 |
0.9918 times |
Fri 26 September 2025 |
17.62 (-0.68%) |
17.59 |
17.52 - 17.85 |
0.9268 times |
Fri 19 September 2025 |
17.74 (-0.89%) |
17.85 |
17.67 - 18.02 |
2.0725 times |
Fri 12 September 2025 |
17.90 (2.11%) |
17.50 |
17.42 - 17.96 |
0.9451 times |
Fri 05 September 2025 |
17.53 (-0.23%) |
17.49 |
17.38 - 17.75 |
1.0594 times |
Fri 29 August 2025 |
17.57 (0%) |
17.28 |
17.28 - 17.60 |
0.4477 times |
Fri 29 August 2025 |
17.57 (1.56%) |
17.37 |
17.02 - 17.60 |
1.2171 times |
Fri 22 August 2025 |
17.30 (1.23%) |
16.98 |
16.85 - 17.36 |
2.8685 times |

Monthly price and charts TeucriumCorn Strong monthly Stock price targets for TeucriumCorn CORN are 17.41 and 17.96 | Monthly Target 1 | 16.97 | | Monthly Target 2 | 17.29 | | Monthly Target 3 | 17.516666666667 | | Monthly Target 4 | 17.84 | | Monthly Target 5 | 18.07 |
Monthly price and volumes Teucrium Corn
| Date |
Closing |
Open |
Range |
Volume |
Fri 24 October 2025 |
17.62 (0.97%) |
17.32 |
17.19 - 17.74 |
0.5597 times |
Tue 30 September 2025 |
17.45 (-0.68%) |
17.49 |
17.38 - 18.02 |
1.0144 times |
Fri 29 August 2025 |
17.57 (1.8%) |
17.25 |
16.61 - 17.60 |
1.1564 times |
Thu 31 July 2025 |
17.26 (-2.49%) |
17.55 |
17.11 - 18.28 |
0.498 times |
Mon 30 June 2025 |
17.70 (-2.32%) |
18.17 |
17.51 - 18.62 |
0.649 times |
Fri 30 May 2025 |
18.12 (-3.31%) |
18.87 |
17.90 - 18.99 |
0.9275 times |
Wed 30 April 2025 |
18.74 (0.97%) |
18.67 |
18.37 - 19.76 |
1.277 times |
Mon 31 March 2025 |
18.56 (-2.67%) |
19.00 |
18.17 - 19.33 |
1.0955 times |
Fri 28 February 2025 |
19.07 (-3.64%) |
19.51 |
19.05 - 20.69 |
1.3989 times |
Fri 31 January 2025 |
19.79 (5.43%) |
18.74 |
18.47 - 20.19 |
1.4236 times |
Tue 31 December 2024 |
18.77 (5.63%) |
17.97 |
17.83 - 18.80 |
0.6883 times |

DMA SMA EMA moving averages of Teucrium Corn CORN
DMA (daily moving average) of Teucrium Corn CORN
| DMA period | DMA value | | 5 day DMA | 17.56 | | 12 day DMA | 17.46 | | 20 day DMA | 17.51 | | 35 day DMA | 17.6 | | 50 day DMA | 17.52 | | 100 day DMA | 17.58 | | 150 day DMA | 17.96 | | 200 day DMA | 18.37 | EMA (exponential moving average) of Teucrium Corn CORN
| EMA period | EMA current | EMA prev | EMA prev2 | | 5 day EMA | 17.57 | 17.55 | 17.49 | | 12 day EMA | 17.53 | 17.51 | 17.48 | | 20 day EMA | 17.53 | 17.52 | 17.5 | | 35 day EMA | 17.49 | 17.48 | 17.47 | | 50 day EMA | 17.48 | 17.47 | 17.46 |
SMA (simple moving average) of Teucrium Corn CORN
| SMA period | SMA current | SMA prev | SMA prev2 | | 5 day SMA | 17.56 | 17.55 | 17.51 | | 12 day SMA | 17.46 | 17.46 | 17.44 | | 20 day SMA | 17.51 | 17.51 | 17.51 | | 35 day SMA | 17.6 | 17.59 | 17.59 | | 50 day SMA | 17.52 | 17.51 | 17.49 | | 100 day SMA | 17.58 | 17.58 | 17.58 | | 150 day SMA | 17.96 | 17.97 | 17.98 | | 200 day SMA | 18.37 | 18.37 | 18.38 |
|
|
