CoreMolding CMT full analysis,charts,indicators,moving averages,SMA,DMA,EMA,ADX,MACD,RSICore Molding CMT WideScreen charts, DMA,SMA,EMA technical analysis, forecast prediction, by indicators ADX,MACD,RSI,CCI AMEX stock exchange
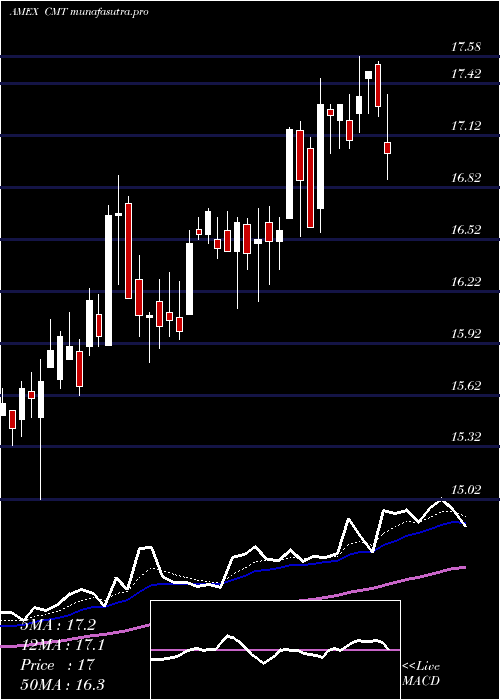
Daily price and charts and targets CoreMolding Strong Daily Stock price targets for CoreMolding CMT are 18.95 and 19.19 | Daily Target 1 | 18.9 | | Daily Target 2 | 18.99 | | Daily Target 3 | 19.143333333333 | | Daily Target 4 | 19.23 | | Daily Target 5 | 19.38 |
Daily price and volume Core Molding
| Date |
Closing |
Open |
Range |
Volume |
Thu 23 October 2025 |
19.07 (0.69%) |
19.24 |
19.06 - 19.30 |
0.25 times |
Wed 22 October 2025 |
18.94 (0.74%) |
18.81 |
18.70 - 19.14 |
0.3938 times |
Tue 21 October 2025 |
18.80 (1.08%) |
18.56 |
18.56 - 19.45 |
1.2636 times |
Mon 20 October 2025 |
18.60 (0.59%) |
18.31 |
18.31 - 18.80 |
0.7561 times |
Fri 17 October 2025 |
18.49 (-0.64%) |
18.41 |
18.41 - 18.84 |
0.7912 times |
Thu 16 October 2025 |
18.61 (-1.12%) |
18.80 |
18.59 - 18.88 |
0.7492 times |
Wed 15 October 2025 |
18.82 (3.18%) |
18.25 |
18.25 - 18.98 |
1.1804 times |
Tue 14 October 2025 |
18.24 (0.05%) |
18.03 |
17.88 - 18.49 |
1.589 times |
Mon 13 October 2025 |
18.23 (1%) |
17.91 |
17.50 - 18.74 |
1.2939 times |
Fri 10 October 2025 |
18.05 (-1.42%) |
18.44 |
18.00 - 18.76 |
1.7328 times |
Thu 09 October 2025 |
18.31 (-2.5%) |
18.82 |
18.31 - 18.89 |
1.2182 times |
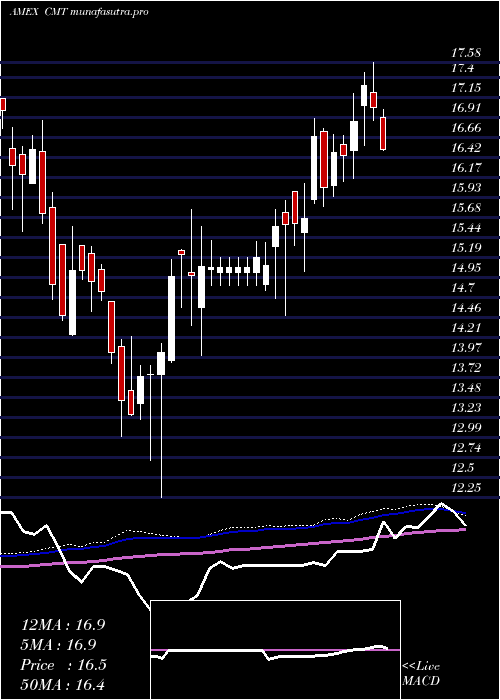
Weekly price and charts CoreMolding Strong weekly Stock price targets for CoreMolding CMT are 18.69 and 19.83 | Weekly Target 1 | 17.8 | | Weekly Target 2 | 18.44 | | Weekly Target 3 | 18.943333333333 | | Weekly Target 4 | 19.58 | | Weekly Target 5 | 20.08 |
Weekly price and volumes for Core Molding
| Date |
Closing |
Open |
Range |
Volume |
Thu 23 October 2025 |
19.07 (3.14%) |
18.31 |
18.31 - 19.45 |
0.2778 times |
Fri 17 October 2025 |
18.49 (2.44%) |
17.91 |
17.50 - 18.98 |
0.5845 times |
Fri 10 October 2025 |
18.05 (-4.4%) |
18.91 |
18.00 - 19.34 |
0.9273 times |
Fri 03 October 2025 |
18.88 (-12.92%) |
21.79 |
16.85 - 21.79 |
0.9437 times |
Fri 26 September 2025 |
21.68 (0.84%) |
21.50 |
21.25 - 22.29 |
0.9053 times |
Fri 19 September 2025 |
21.50 (1.32%) |
21.32 |
20.96 - 22.00 |
1.7324 times |
Fri 12 September 2025 |
21.22 (7.23%) |
19.79 |
19.01 - 21.42 |
2.9715 times |
Fri 05 September 2025 |
19.79 (3.07%) |
19.09 |
18.64 - 19.79 |
0.7095 times |
Fri 29 August 2025 |
19.20 (0%) |
18.99 |
18.92 - 19.41 |
0.1571 times |
Fri 29 August 2025 |
19.20 (-1.39%) |
19.40 |
18.41 - 19.41 |
0.7908 times |
Fri 22 August 2025 |
19.47 (12.22%) |
17.50 |
17.15 - 19.47 |
1.0197 times |
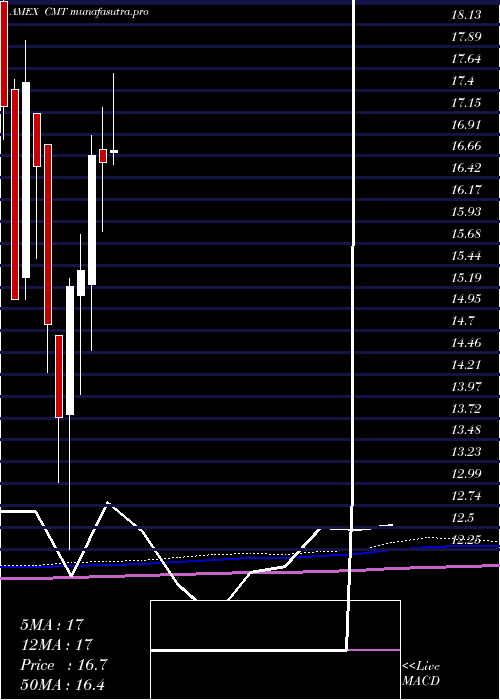
Monthly price and charts CoreMolding Strong monthly Stock price targets for CoreMolding CMT are 16.1 and 19.83 | Monthly Target 1 | 15.1 | | Monthly Target 2 | 17.09 | | Monthly Target 3 | 18.833333333333 | | Monthly Target 4 | 20.82 | | Monthly Target 5 | 22.56 |
Monthly price and volumes Core Molding
| Date |
Closing |
Open |
Range |
Volume |
Thu 23 October 2025 |
19.07 (-7.2%) |
20.32 |
16.85 - 20.58 |
0.4351 times |
Tue 30 September 2025 |
20.55 (7.03%) |
19.09 |
18.64 - 22.29 |
1.2468 times |
Fri 29 August 2025 |
19.20 (15.38%) |
16.52 |
16.44 - 19.47 |
0.703 times |
Thu 31 July 2025 |
16.64 (0.3%) |
16.70 |
16.48 - 17.75 |
0.7318 times |
Mon 30 June 2025 |
16.59 (-0.48%) |
16.73 |
15.81 - 17.20 |
1.3237 times |
Fri 30 May 2025 |
16.67 (8.39%) |
15.22 |
14.48 - 16.89 |
0.8224 times |
Wed 30 April 2025 |
15.38 (1.18%) |
15.10 |
13.99 - 15.78 |
1.0003 times |
Mon 31 March 2025 |
15.20 (10.71%) |
13.76 |
12.25 - 15.29 |
1.2589 times |
Fri 28 February 2025 |
13.73 (-7.04%) |
14.65 |
13.00 - 14.65 |
1.0328 times |
Fri 31 January 2025 |
14.77 (-10.7%) |
16.79 |
14.23 - 16.79 |
1.4452 times |
Tue 31 December 2024 |
16.54 (-5.38%) |
17.14 |
15.51 - 17.14 |
1.1344 times |
DMA SMA EMA moving averages of Core Molding CMT
DMA (daily moving average) of Core Molding CMT
| DMA period | DMA value | | 5 day DMA | 18.78 | | 12 day DMA | 18.58 | | 20 day DMA | 19.11 | | 35 day DMA | 19.95 | | 50 day DMA | 19.59 | | 100 day DMA | 18.22 | | 150 day DMA | 17.26 | | 200 day DMA | 16.48 | EMA (exponential moving average) of Core Molding CMT
| EMA period | EMA current | EMA prev | EMA prev2 | | 5 day EMA | 18.85 | 18.74 | 18.64 | | 12 day EMA | 18.88 | 18.85 | 18.83 | | 20 day EMA | 19.09 | 19.09 | 19.11 | | 35 day EMA | 19.11 | 19.11 | 19.12 | | 50 day EMA | 19.31 | 19.32 | 19.34 |
SMA (simple moving average) of Core Molding CMT
| SMA period | SMA current | SMA prev | SMA prev2 | | 5 day SMA | 18.78 | 18.69 | 18.66 | | 12 day SMA | 18.58 | 18.55 | 18.56 | | 20 day SMA | 19.11 | 19.23 | 19.37 | | 35 day SMA | 19.95 | 19.96 | 19.97 | | 50 day SMA | 19.59 | 19.56 | 19.52 | | 100 day SMA | 18.22 | 18.2 | 18.17 | | 150 day SMA | 17.26 | 17.23 | 17.2 | | 200 day SMA | 16.48 | 16.46 | 16.44 |
|
|
