SP CGW full analysis,charts,indicators,moving averages,SMA,DMA,EMA,ADX,MACD,RSIS P CGW WideScreen charts, DMA,SMA,EMA technical analysis, forecast prediction, by indicators ADX,MACD,RSI,CCI AMEX stock exchange
Daily price and charts and targets SP Strong Daily Stock price targets for SP CGW are 65.86 and 66.21 | Daily Target 1 | 65.58 | | Daily Target 2 | 65.78 | | Daily Target 3 | 65.93 | | Daily Target 4 | 66.13 | | Daily Target 5 | 66.28 |
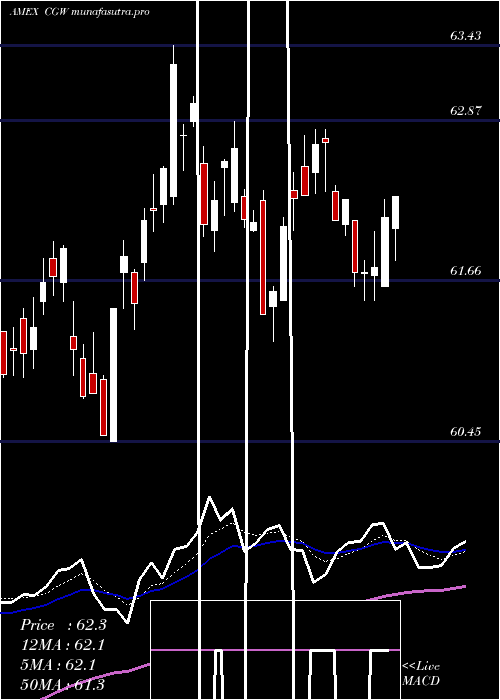
Daily price and volume S P
| Date |
Closing |
Open |
Range |
Volume |
Fri 24 October 2025 |
65.98 (0.38%) |
65.73 |
65.73 - 66.08 |
0.9079 times |
Thu 23 October 2025 |
65.73 (0.74%) |
65.48 |
65.24 - 65.75 |
0.7144 times |
Wed 22 October 2025 |
65.25 (-0.11%) |
65.57 |
65.25 - 65.84 |
1.4214 times |
Tue 21 October 2025 |
65.32 (-0.4%) |
65.29 |
65.22 - 65.49 |
0.9827 times |
Mon 20 October 2025 |
65.58 (0.92%) |
64.99 |
64.98 - 65.58 |
1.2351 times |
Fri 17 October 2025 |
64.98 (0.59%) |
64.54 |
64.45 - 64.98 |
0.7861 times |
Thu 16 October 2025 |
64.60 (0.09%) |
64.61 |
64.34 - 64.71 |
0.404 times |
Wed 15 October 2025 |
64.54 (1.11%) |
64.19 |
64.02 - 64.55 |
1.9122 times |
Tue 14 October 2025 |
63.83 (1.01%) |
62.96 |
62.96 - 64.00 |
0.6923 times |
Mon 13 October 2025 |
63.19 (0.4%) |
63.22 |
63.15 - 63.47 |
0.944 times |
Fri 10 October 2025 |
62.94 (-0.99%) |
63.66 |
62.91 - 63.71 |
2.2559 times |
Weekly price and charts SP Strong weekly Stock price targets for SP CGW are 65.48 and 66.58 | Weekly Target 1 | 64.58 | | Weekly Target 2 | 65.28 | | Weekly Target 3 | 65.68 | | Weekly Target 4 | 66.38 | | Weekly Target 5 | 66.78 |
Weekly price and volumes for S P
| Date |
Closing |
Open |
Range |
Volume |
Fri 24 October 2025 |
65.98 (1.54%) |
64.99 |
64.98 - 66.08 |
0.7057 times |
Fri 17 October 2025 |
64.98 (3.24%) |
63.22 |
62.96 - 64.98 |
0.6355 times |
Fri 10 October 2025 |
62.94 (-2.02%) |
64.22 |
62.91 - 64.38 |
0.9016 times |
Fri 03 October 2025 |
64.24 (1.57%) |
63.45 |
63.32 - 64.50 |
3.3865 times |
Fri 26 September 2025 |
63.25 (-0.27%) |
63.33 |
62.60 - 63.91 |
1.3329 times |
Fri 19 September 2025 |
63.42 (-0.67%) |
64.06 |
63.34 - 64.21 |
1.0628 times |
Fri 12 September 2025 |
63.85 (-0.81%) |
64.57 |
62.90 - 64.57 |
0.6499 times |
Fri 05 September 2025 |
64.37 (0.23%) |
63.09 |
62.84 - 64.67 |
0.6012 times |
Fri 29 August 2025 |
64.22 (0%) |
64.44 |
64.12 - 64.56 |
0.0954 times |
Fri 29 August 2025 |
64.22 (-1.82%) |
65.23 |
64.12 - 65.32 |
0.6285 times |
Fri 22 August 2025 |
65.41 (1.76%) |
64.33 |
64.05 - 65.62 |
0.6512 times |

Monthly price and charts SP Strong monthly Stock price targets for SP CGW are 64.45 and 67.62 | Monthly Target 1 | 61.82 | | Monthly Target 2 | 63.9 | | Monthly Target 3 | 64.99 | | Monthly Target 4 | 67.07 | | Monthly Target 5 | 68.16 |
Monthly price and volumes S P
| Date |
Closing |
Open |
Range |
Volume |
Fri 24 October 2025 |
65.98 (2.71%) |
64.26 |
62.91 - 66.08 |
1.2064 times |
Tue 30 September 2025 |
64.24 (0.03%) |
63.09 |
62.60 - 64.67 |
0.8345 times |
Fri 29 August 2025 |
64.22 (3.35%) |
62.05 |
61.81 - 65.62 |
0.5585 times |
Thu 31 July 2025 |
62.14 (-0.58%) |
62.29 |
61.20 - 63.43 |
0.7089 times |
Mon 30 June 2025 |
62.50 (2.39%) |
61.10 |
60.45 - 62.52 |
0.6175 times |
Fri 30 May 2025 |
61.04 (3.62%) |
58.61 |
58.38 - 61.36 |
1.2317 times |
Wed 30 April 2025 |
58.91 (5.78%) |
55.69 |
50.77 - 58.91 |
1.573 times |
Mon 31 March 2025 |
55.69 (0.41%) |
55.64 |
55.01 - 57.29 |
1.1767 times |
Fri 28 February 2025 |
55.46 (0.45%) |
54.70 |
54.08 - 56.32 |
0.9645 times |
Fri 31 January 2025 |
55.21 (1.86%) |
54.41 |
51.78 - 55.61 |
1.1283 times |
Tue 31 December 2024 |
54.20 (-8.51%) |
59.84 |
53.86 - 60.05 |
0.9357 times |

DMA SMA EMA moving averages of S P CGW
DMA (daily moving average) of S P CGW
| DMA period | DMA value | | 5 day DMA | 65.57 | | 12 day DMA | 64.63 | | 20 day DMA | 64.39 | | 35 day DMA | 64.03 | | 50 day DMA | 64.11 | | 100 day DMA | 63.19 | | 150 day DMA | 61.29 | | 200 day DMA | 59.8 | EMA (exponential moving average) of S P CGW
| EMA period | EMA current | EMA prev | EMA prev2 | | 5 day EMA | 65.51 | 65.28 | 65.06 | | 12 day EMA | 64.96 | 64.77 | 64.59 | | 20 day EMA | 64.61 | 64.47 | 64.34 | | 35 day EMA | 64.42 | 64.33 | 64.25 | | 50 day EMA | 64.28 | 64.21 | 64.15 |
SMA (simple moving average) of S P CGW
| SMA period | SMA current | SMA prev | SMA prev2 | | 5 day SMA | 65.57 | 65.37 | 65.15 | | 12 day SMA | 64.63 | 64.46 | 64.31 | | 20 day SMA | 64.39 | 64.25 | 64.1 | | 35 day SMA | 64.03 | 63.99 | 63.93 | | 50 day SMA | 64.11 | 64.08 | 64.05 | | 100 day SMA | 63.19 | 63.14 | 63.1 | | 150 day SMA | 61.29 | 61.22 | 61.15 | | 200 day SMA | 59.8 | 59.73 | 59.67 |
|
|
