WisdomtreeEmerging CEW full analysis,charts,indicators,moving averages,SMA,DMA,EMA,ADX,MACD,RSIWisdomtree Emerging CEW WideScreen charts, DMA,SMA,EMA technical analysis, forecast prediction, by indicators ADX,MACD,RSI,CCI AMEX stock exchange
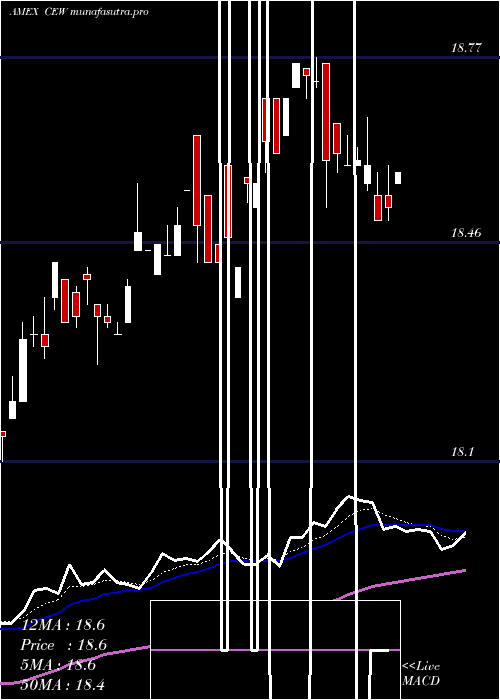
Daily price and charts and targets WisdomtreeEmerging Strong Daily Stock price targets for WisdomtreeEmerging CEW are 18.97 and 18.97 | Daily Target 1 | 18.97 | | Daily Target 2 | 18.97 | | Daily Target 3 | 18.97 | | Daily Target 4 | 18.97 | | Daily Target 5 | 18.97 |
Daily price and volume Wisdomtree Emerging
| Date |
Closing |
Open |
Range |
Volume |
Thu 23 October 2025 |
18.97 (0.16%) |
18.97 |
18.97 - 18.97 |
0.0356 times |
Wed 22 October 2025 |
18.94 (-0.21%) |
18.97 |
18.94 - 18.97 |
0.8636 times |
Tue 21 October 2025 |
18.98 (0.05%) |
18.95 |
18.94 - 18.98 |
0.3857 times |
Mon 20 October 2025 |
18.97 (0.26%) |
19.00 |
18.97 - 19.00 |
3.3815 times |
Fri 17 October 2025 |
18.92 (0.11%) |
18.91 |
18.91 - 18.92 |
0.1661 times |
Thu 16 October 2025 |
18.90 (0.16%) |
18.85 |
18.85 - 18.90 |
1.2514 times |
Wed 15 October 2025 |
18.87 (0.43%) |
18.87 |
18.82 - 18.87 |
0.5637 times |
Tue 14 October 2025 |
18.79 (-0.11%) |
18.79 |
18.79 - 18.79 |
0.0593 times |
Mon 13 October 2025 |
18.81 (0.21%) |
18.76 |
18.76 - 18.82 |
0.445 times |
Fri 10 October 2025 |
18.77 (-0.16%) |
18.80 |
18.71 - 19.31 |
2.8481 times |
Thu 09 October 2025 |
18.80 (-0.16%) |
18.86 |
18.80 - 18.90 |
1.6614 times |
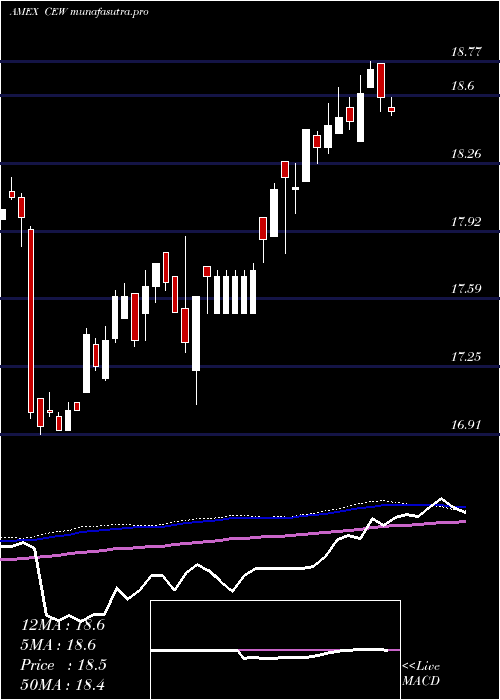
Weekly price and charts WisdomtreeEmerging Strong weekly Stock price targets for WisdomtreeEmerging CEW are 18.93 and 18.99 | Weekly Target 1 | 18.91 | | Weekly Target 2 | 18.94 | | Weekly Target 3 | 18.97 | | Weekly Target 4 | 19 | | Weekly Target 5 | 19.03 |
Weekly price and volumes for Wisdomtree Emerging
| Date |
Closing |
Open |
Range |
Volume |
Thu 23 October 2025 |
18.97 (0.26%) |
19.00 |
18.94 - 19.00 |
0.8489 times |
Fri 17 October 2025 |
18.92 (0.8%) |
18.76 |
18.76 - 18.92 |
0.4522 times |
Fri 10 October 2025 |
18.77 (-0.64%) |
18.86 |
18.71 - 19.31 |
1.3244 times |
Fri 03 October 2025 |
18.89 (0.59%) |
18.86 |
18.77 - 18.91 |
3.289 times |
Fri 26 September 2025 |
18.78 (-0.48%) |
18.96 |
18.74 - 18.96 |
0.4749 times |
Fri 19 September 2025 |
18.87 (0.16%) |
18.85 |
18.84 - 19.03 |
0.7826 times |
Fri 12 September 2025 |
18.84 (0.11%) |
18.91 |
18.79 - 18.91 |
0.5127 times |
Fri 05 September 2025 |
18.82 (0.7%) |
18.63 |
18.62 - 18.82 |
1.2737 times |
Fri 29 August 2025 |
18.69 (0%) |
18.68 |
18.68 - 18.69 |
0.027 times |
Fri 29 August 2025 |
18.69 (-0.05%) |
18.62 |
18.61 - 18.72 |
1.0146 times |
Fri 22 August 2025 |
18.70 (0.59%) |
18.58 |
18.37 - 18.70 |
0.6962 times |
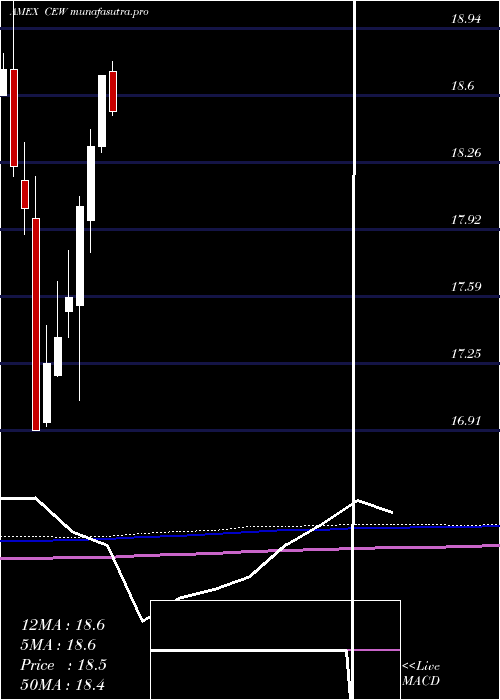
Monthly price and charts WisdomtreeEmerging Strong monthly Stock price targets for WisdomtreeEmerging CEW are 18.84 and 19.44 | Monthly Target 1 | 18.4 | | Monthly Target 2 | 18.68 | | Monthly Target 3 | 18.996666666667 | | Monthly Target 4 | 19.28 | | Monthly Target 5 | 19.6 |
Monthly price and volumes Wisdomtree Emerging
| Date |
Closing |
Open |
Range |
Volume |
Thu 23 October 2025 |
18.97 (0.8%) |
18.87 |
18.71 - 19.31 |
1.2528 times |
Tue 30 September 2025 |
18.82 (0.7%) |
18.63 |
18.62 - 19.03 |
0.7074 times |
Fri 29 August 2025 |
18.69 (1.74%) |
18.48 |
18.37 - 18.72 |
0.8408 times |
Thu 31 July 2025 |
18.37 (-1.76%) |
18.72 |
18.35 - 18.77 |
0.9481 times |
Mon 30 June 2025 |
18.70 (1.96%) |
18.34 |
18.31 - 18.70 |
0.6979 times |
Fri 30 May 2025 |
18.34 (1.66%) |
17.97 |
17.81 - 18.43 |
1.2553 times |
Wed 30 April 2025 |
18.04 (2.62%) |
17.54 |
17.06 - 18.09 |
3.3445 times |
Mon 31 March 2025 |
17.58 (1.15%) |
17.51 |
17.38 - 17.82 |
0.3939 times |
Fri 28 February 2025 |
17.38 (0.75%) |
17.19 |
17.18 - 17.66 |
0.4287 times |
Fri 31 January 2025 |
17.25 (2.01%) |
16.95 |
16.93 - 17.44 |
0.1306 times |
Tue 31 December 2024 |
16.91 (-6.21%) |
17.98 |
16.91 - 18.19 |
0.2288 times |
DMA SMA EMA moving averages of Wisdomtree Emerging CEW
DMA (daily moving average) of Wisdomtree Emerging CEW
| DMA period | DMA value | | 5 day DMA | 18.96 | | 12 day DMA | 18.88 | | 20 day DMA | 18.86 | | 35 day DMA | 18.86 | | 50 day DMA | 18.8 | | 100 day DMA | 18.67 | | 150 day DMA | 18.41 | | 200 day DMA | 18.17 | EMA (exponential moving average) of Wisdomtree Emerging CEW
| EMA period | EMA current | EMA prev | EMA prev2 | | 5 day EMA | 18.94 | 18.93 | 18.93 | | 12 day EMA | 18.91 | 18.9 | 18.89 | | 20 day EMA | 18.88 | 18.87 | 18.86 | | 35 day EMA | 18.84 | 18.83 | 18.82 | | 50 day EMA | 18.81 | 18.8 | 18.79 |
SMA (simple moving average) of Wisdomtree Emerging CEW
| SMA period | SMA current | SMA prev | SMA prev2 | | 5 day SMA | 18.96 | 18.94 | 18.93 | | 12 day SMA | 18.88 | 18.87 | 18.86 | | 20 day SMA | 18.86 | 18.85 | 18.84 | | 35 day SMA | 18.86 | 18.85 | 18.85 | | 50 day SMA | 18.8 | 18.79 | 18.79 | | 100 day SMA | 18.67 | 18.67 | 18.66 | | 150 day SMA | 18.41 | 18.4 | 18.39 | | 200 day SMA | 18.17 | 18.16 | 18.15 |
|
|
