CambriaCore CCOR full analysis,charts,indicators,moving averages,SMA,DMA,EMA,ADX,MACD,RSICambria Core CCOR WideScreen charts, DMA,SMA,EMA technical analysis, forecast prediction, by indicators ADX,MACD,RSI,CCI AMEX stock exchange
Daily price and charts and targets CambriaCore Strong Daily Stock price targets for CambriaCore CCOR are 26.16 and 26.16 | Daily Target 1 | 26.16 | | Daily Target 2 | 26.16 | | Daily Target 3 | 26.16 | | Daily Target 4 | 26.16 | | Daily Target 5 | 26.16 |
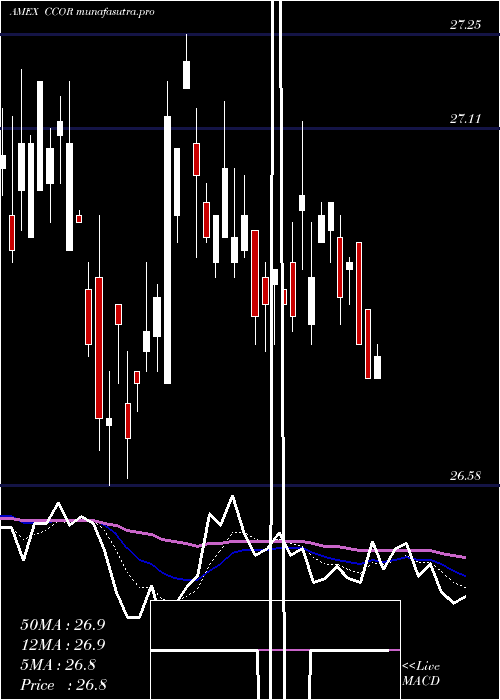
Daily price and volume Cambria Core
| Date |
Closing |
Open |
Range |
Volume |
Thu 23 October 2025 |
26.16 (-0.19%) |
26.16 |
26.16 - 26.16 |
0.2046 times |
Wed 22 October 2025 |
26.21 (0.04%) |
26.25 |
26.21 - 26.27 |
1.1934 times |
Tue 21 October 2025 |
26.20 (-0.34%) |
25.96 |
25.96 - 26.28 |
0.9366 times |
Mon 20 October 2025 |
26.29 (0.19%) |
26.26 |
26.23 - 26.29 |
0.4398 times |
Fri 17 October 2025 |
26.24 (0.15%) |
26.31 |
26.20 - 26.31 |
1.098 times |
Thu 16 October 2025 |
26.20 (-0.34%) |
26.31 |
26.17 - 26.35 |
0.9042 times |
Wed 15 October 2025 |
26.29 (0.19%) |
26.40 |
26.27 - 26.41 |
1.1527 times |
Tue 14 October 2025 |
26.24 (0.11%) |
26.22 |
26.19 - 26.25 |
3.2781 times |
Mon 13 October 2025 |
26.21 (-0.38%) |
26.23 |
26.15 - 26.24 |
0.4323 times |
Fri 10 October 2025 |
26.31 (0.34%) |
26.27 |
26.21 - 26.31 |
0.3602 times |
Thu 09 October 2025 |
26.22 (-0.64%) |
26.27 |
26.22 - 26.27 |
0.036 times |
Weekly price and charts CambriaCore Strong weekly Stock price targets for CambriaCore CCOR are 25.9 and 26.23 | Weekly Target 1 | 25.81 | | Weekly Target 2 | 25.98 | | Weekly Target 3 | 26.136666666667 | | Weekly Target 4 | 26.31 | | Weekly Target 5 | 26.47 |
Weekly price and volumes for Cambria Core
| Date |
Closing |
Open |
Range |
Volume |
Thu 23 October 2025 |
26.16 (-0.3%) |
26.26 |
25.96 - 26.29 |
0.1732 times |
Fri 17 October 2025 |
26.24 (-0.27%) |
26.23 |
26.15 - 26.41 |
0.4285 times |
Fri 10 October 2025 |
26.31 (0.65%) |
26.31 |
26.05 - 26.40 |
0.4452 times |
Fri 03 October 2025 |
26.14 (0.04%) |
26.06 |
26.00 - 26.18 |
0.3847 times |
Fri 26 September 2025 |
26.13 (-0.08%) |
26.09 |
26.00 - 26.18 |
2.5609 times |
Fri 19 September 2025 |
26.15 (-1.25%) |
26.54 |
26.11 - 26.54 |
0.1911 times |
Fri 12 September 2025 |
26.48 (0.11%) |
26.34 |
26.28 - 26.54 |
2.1719 times |
Fri 05 September 2025 |
26.45 (-1.16%) |
26.65 |
26.41 - 26.69 |
2.9858 times |
Fri 29 August 2025 |
26.76 (0%) |
26.73 |
26.69 - 26.76 |
0.2631 times |
Fri 29 August 2025 |
26.76 (-0.52%) |
26.78 |
26.63 - 26.81 |
0.3957 times |
Fri 22 August 2025 |
26.90 (0.82%) |
26.75 |
26.61 - 27.02 |
0.389 times |

Monthly price and charts CambriaCore Strong monthly Stock price targets for CambriaCore CCOR are 26.06 and 26.51 | Monthly Target 1 | 25.73 | | Monthly Target 2 | 25.94 | | Monthly Target 3 | 26.176666666667 | | Monthly Target 4 | 26.39 | | Monthly Target 5 | 26.63 |
Monthly price and volumes Cambria Core
| Date |
Closing |
Open |
Range |
Volume |
Thu 23 October 2025 |
26.16 (0.11%) |
26.05 |
25.96 - 26.41 |
0.124 times |
Tue 30 September 2025 |
26.13 (-2.35%) |
26.65 |
26.00 - 26.69 |
0.7949 times |
Fri 29 August 2025 |
26.76 (0.07%) |
26.74 |
26.27 - 27.02 |
0.1701 times |
Thu 31 July 2025 |
26.74 (-0.45%) |
26.73 |
26.73 - 27.25 |
0.2674 times |
Mon 30 June 2025 |
26.86 (-0.78%) |
26.88 |
26.58 - 27.20 |
0.8967 times |
Fri 30 May 2025 |
27.07 (-1.6%) |
27.44 |
26.89 - 27.59 |
0.3674 times |
Wed 30 April 2025 |
27.51 (2.88%) |
26.81 |
26.05 - 28.13 |
1.1222 times |
Mon 31 March 2025 |
26.74 (1.17%) |
26.62 |
26.24 - 27.69 |
0.9362 times |
Fri 28 February 2025 |
26.43 (2.36%) |
25.95 |
25.11 - 26.43 |
0.4229 times |
Fri 31 January 2025 |
25.82 (0.74%) |
25.66 |
25.07 - 26.21 |
4.8982 times |
Tue 31 December 2024 |
25.63 (-3.97%) |
26.61 |
25.26 - 26.61 |
0.506 times |

DMA SMA EMA moving averages of Cambria Core CCOR
DMA (daily moving average) of Cambria Core CCOR
| DMA period | DMA value | | 5 day DMA | 26.22 | | 12 day DMA | 26.25 | | 20 day DMA | 26.21 | | 35 day DMA | 26.25 | | 50 day DMA | 26.39 | | 100 day DMA | 26.63 | | 150 day DMA | 26.82 | | 200 day DMA | 26.62 | EMA (exponential moving average) of Cambria Core CCOR
| EMA period | EMA current | EMA prev | EMA prev2 | | 5 day EMA | 26.21 | 26.23 | 26.24 | | 12 day EMA | 26.23 | 26.24 | 26.24 | | 20 day EMA | 26.24 | 26.25 | 26.25 | | 35 day EMA | 26.31 | 26.32 | 26.33 | | 50 day EMA | 26.38 | 26.39 | 26.4 |
SMA (simple moving average) of Cambria Core CCOR
| SMA period | SMA current | SMA prev | SMA prev2 | | 5 day SMA | 26.22 | 26.23 | 26.24 | | 12 day SMA | 26.25 | 26.26 | 26.27 | | 20 day SMA | 26.21 | 26.21 | 26.2 | | 35 day SMA | 26.25 | 26.26 | 26.27 | | 50 day SMA | 26.39 | 26.4 | 26.41 | | 100 day SMA | 26.63 | 26.64 | 26.65 | | 150 day SMA | 26.82 | 26.82 | 26.82 | | 200 day SMA | 26.62 | 26.61 | 26.61 |
|
|
