CboeGlobal CBOE full analysis,charts,indicators,moving averages,SMA,DMA,EMA,ADX,MACD,RSICboe Global CBOE WideScreen charts, DMA,SMA,EMA technical analysis, forecast prediction, by indicators ADX,MACD,RSI,CCI AMEX stock exchange
Daily price and charts and targets CboeGlobal Strong Daily Stock price targets for CboeGlobal CBOE are 236.23 and 241.89 | Daily Target 1 | 232.11 | | Daily Target 2 | 234.68 | | Daily Target 3 | 237.76666666667 | | Daily Target 4 | 240.34 | | Daily Target 5 | 243.43 |
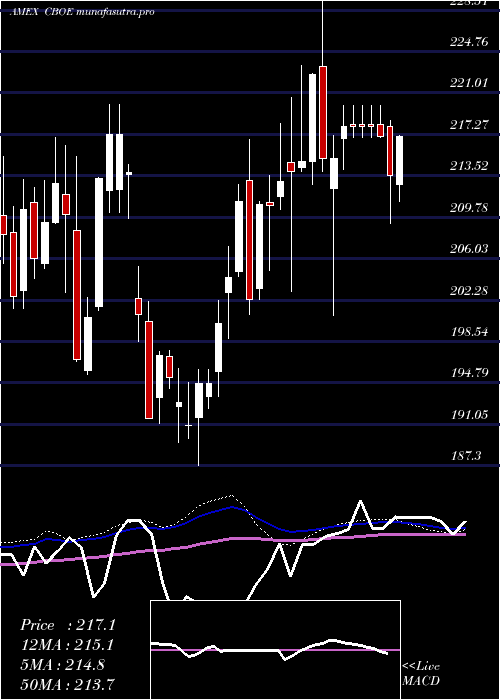
Daily price and volume Cboe Global
| Date |
Closing |
Open |
Range |
Volume |
Thu 23 October 2025 |
237.26 (-0.18%) |
235.88 |
235.19 - 240.85 |
0.3752 times |
Wed 22 October 2025 |
237.69 (1.89%) |
234.00 |
231.60 - 238.72 |
0.6099 times |
Tue 21 October 2025 |
233.29 (-1.66%) |
237.09 |
232.82 - 238.19 |
0.9725 times |
Mon 20 October 2025 |
237.22 (-1%) |
238.71 |
233.53 - 239.25 |
0.4694 times |
Fri 17 October 2025 |
239.62 (1.55%) |
236.90 |
236.60 - 240.41 |
0.7943 times |
Thu 16 October 2025 |
235.97 (-2.39%) |
242.39 |
235.00 - 242.60 |
0.7144 times |
Wed 15 October 2025 |
241.74 (1.48%) |
239.05 |
236.95 - 243.79 |
1.5983 times |
Tue 14 October 2025 |
238.21 (-2.17%) |
243.89 |
237.41 - 246.64 |
1.7961 times |
Mon 13 October 2025 |
243.49 (-0.5%) |
246.40 |
241.23 - 246.40 |
1.4065 times |
Fri 10 October 2025 |
244.71 (1.64%) |
241.46 |
240.29 - 246.38 |
1.2634 times |
Thu 09 October 2025 |
240.77 (-0.2%) |
241.90 |
239.53 - 242.14 |
0.9424 times |

Weekly price and charts CboeGlobal Strong weekly Stock price targets for CboeGlobal CBOE are 229.81 and 239.06 | Weekly Target 1 | 227.32 | | Weekly Target 2 | 232.29 | | Weekly Target 3 | 236.57 | | Weekly Target 4 | 241.54 | | Weekly Target 5 | 245.82 |
Weekly price and volumes for Cboe Global
| Date |
Closing |
Open |
Range |
Volume |
Thu 23 October 2025 |
237.26 (-0.98%) |
238.71 |
231.60 - 240.85 |
0.3848 times |
Fri 17 October 2025 |
239.62 (-2.08%) |
246.40 |
235.00 - 246.64 |
1.0004 times |
Fri 10 October 2025 |
244.71 (2.16%) |
238.85 |
234.72 - 246.38 |
0.8745 times |
Fri 03 October 2025 |
239.54 (-1.63%) |
244.07 |
239.00 - 248.99 |
0.9993 times |
Fri 26 September 2025 |
243.52 (4.49%) |
235.00 |
233.65 - 246.94 |
1.4251 times |
Fri 19 September 2025 |
233.06 (-0.49%) |
233.43 |
231.38 - 238.80 |
1.372 times |
Fri 12 September 2025 |
234.21 (0.7%) |
233.84 |
230.90 - 237.65 |
0.9653 times |
Fri 05 September 2025 |
232.58 (-1.43%) |
236.66 |
230.15 - 238.03 |
1.0723 times |
Fri 29 August 2025 |
235.95 (0%) |
235.70 |
234.56 - 237.43 |
0.2488 times |
Fri 29 August 2025 |
235.95 (-4.25%) |
245.00 |
234.02 - 249.36 |
1.6575 times |
Fri 22 August 2025 |
246.43 (-0.48%) |
246.91 |
243.93 - 252.11 |
1.349 times |
Monthly price and charts CboeGlobal Strong monthly Stock price targets for CboeGlobal CBOE are 226.91 and 241.95 | Monthly Target 1 | 223.46 | | Monthly Target 2 | 230.36 | | Monthly Target 3 | 238.5 | | Monthly Target 4 | 245.4 | | Monthly Target 5 | 253.54 |
Monthly price and volumes Cboe Global
| Date |
Closing |
Open |
Range |
Volume |
Thu 23 October 2025 |
237.26 (-3.26%) |
245.00 |
231.60 - 246.64 |
0.5349 times |
Tue 30 September 2025 |
245.25 (3.94%) |
236.66 |
230.15 - 248.99 |
1.0393 times |
Fri 29 August 2025 |
235.95 (-2.11%) |
241.46 |
234.02 - 255.27 |
1.1407 times |
Thu 31 July 2025 |
241.04 (3.36%) |
233.71 |
227.43 - 248.79 |
1.1783 times |
Mon 30 June 2025 |
233.21 (1.79%) |
230.73 |
218.14 - 233.21 |
0.7569 times |
Fri 30 May 2025 |
229.12 (3.3%) |
220.00 |
212.75 - 236.02 |
1.2589 times |
Wed 30 April 2025 |
221.80 (-1.98%) |
225.52 |
200.88 - 234.37 |
1.2333 times |
Mon 31 March 2025 |
226.29 (7.35%) |
211.70 |
203.05 - 227.22 |
1.0182 times |
Fri 28 February 2025 |
210.80 (3.17%) |
204.91 |
201.00 - 216.83 |
0.8792 times |
Fri 31 January 2025 |
204.33 (4.57%) |
196.35 |
187.30 - 207.17 |
0.9601 times |
Tue 31 December 2024 |
195.40 (-10.08%) |
213.65 |
191.13 - 214.50 |
0.7558 times |

DMA SMA EMA moving averages of Cboe Global CBOE
DMA (daily moving average) of Cboe Global CBOE
| DMA period | DMA value | | 5 day DMA | 237.02 | | 12 day DMA | 239.27 | | 20 day DMA | 240.33 | | 35 day DMA | 238.5 | | 50 day DMA | 239.46 | | 100 day DMA | 237.33 | | 150 day DMA | 231.78 | | 200 day DMA | 225.52 | EMA (exponential moving average) of Cboe Global CBOE
| EMA period | EMA current | EMA prev | EMA prev2 | | 5 day EMA | 237.21 | 237.19 | 236.94 | | 12 day EMA | 238.39 | 238.6 | 238.76 | | 20 day EMA | 239.03 | 239.22 | 239.38 | | 35 day EMA | 239.83 | 239.98 | 240.12 | | 50 day EMA | 239.97 | 240.08 | 240.18 |
SMA (simple moving average) of Cboe Global CBOE
| SMA period | SMA current | SMA prev | SMA prev2 | | 5 day SMA | 237.02 | 236.76 | 237.57 | | 12 day SMA | 239.27 | 239.57 | 239.5 | | 20 day SMA | 240.33 | 240.67 | 240.94 | | 35 day SMA | 238.5 | 238.41 | 238.35 | | 50 day SMA | 239.46 | 239.59 | 239.75 | | 100 day SMA | 237.33 | 237.25 | 237.14 | | 150 day SMA | 231.78 | 231.66 | 231.52 | | 200 day SMA | 225.52 | 225.29 | 225.06 |
|
|
