BarclaysEtn CAPE full analysis,charts,indicators,moving averages,SMA,DMA,EMA,ADX,MACD,RSIBarclays Etn CAPE WideScreen charts, DMA,SMA,EMA technical analysis, forecast prediction, by indicators ADX,MACD,RSI,CCI AMEX stock exchange
Daily price and charts and targets BarclaysEtn Strong Daily Stock price targets for BarclaysEtn CAPE are 32.34 and 32.52 | Daily Target 1 | 32.19 | | Daily Target 2 | 32.3 | | Daily Target 3 | 32.366666666667 | | Daily Target 4 | 32.48 | | Daily Target 5 | 32.55 |
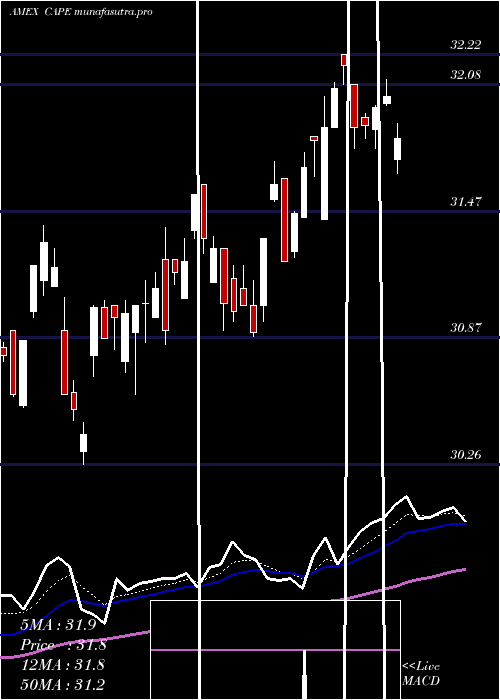
Daily price and volume Barclays Etn
| Date |
Closing |
Open |
Range |
Volume |
Thu 23 October 2025 |
32.42 (0.15%) |
32.37 |
32.25 - 32.43 |
0.4944 times |
Wed 22 October 2025 |
32.37 (-0.09%) |
32.22 |
32.22 - 32.50 |
0.9758 times |
Tue 21 October 2025 |
32.40 (-0.12%) |
32.38 |
32.33 - 32.44 |
0.8139 times |
Mon 20 October 2025 |
32.44 (0.78%) |
32.24 |
32.24 - 32.45 |
0.8209 times |
Fri 17 October 2025 |
32.19 (0.75%) |
31.77 |
31.77 - 32.21 |
0.8147 times |
Thu 16 October 2025 |
31.95 (-0.75%) |
32.20 |
31.89 - 32.29 |
3.3298 times |
Wed 15 October 2025 |
32.19 (0.44%) |
32.10 |
32.07 - 32.33 |
0.5491 times |
Tue 14 October 2025 |
32.05 (1.04%) |
31.51 |
31.51 - 32.10 |
0.657 times |
Mon 13 October 2025 |
31.72 (0.67%) |
31.75 |
31.65 - 31.79 |
0.8384 times |
Fri 10 October 2025 |
31.51 (-1.16%) |
31.90 |
31.51 - 31.90 |
0.706 times |
Thu 09 October 2025 |
31.88 (-0.65%) |
32.06 |
31.87 - 32.12 |
0.7158 times |
Weekly price and charts BarclaysEtn Strong weekly Stock price targets for BarclaysEtn CAPE are 32.32 and 32.6 | Weekly Target 1 | 32.1 | | Weekly Target 2 | 32.26 | | Weekly Target 3 | 32.38 | | Weekly Target 4 | 32.54 | | Weekly Target 5 | 32.66 |
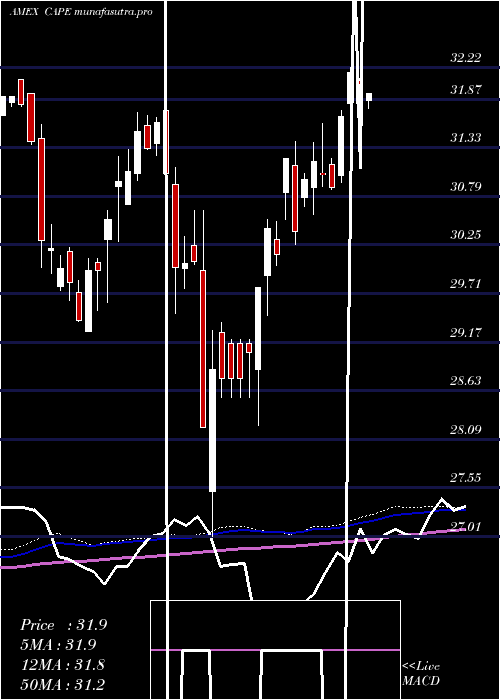
Weekly price and volumes for Barclays Etn
| Date |
Closing |
Open |
Range |
Volume |
Thu 23 October 2025 |
32.42 (0.71%) |
32.24 |
32.22 - 32.50 |
0.7401 times |
Fri 17 October 2025 |
32.19 (2.16%) |
31.75 |
31.51 - 32.33 |
1.4752 times |
Fri 10 October 2025 |
31.51 (-2.54%) |
32.19 |
31.51 - 32.24 |
1.0217 times |
Fri 03 October 2025 |
32.33 (-0.28%) |
32.47 |
32.12 - 32.58 |
1.0749 times |
Fri 26 September 2025 |
32.42 (-0.83%) |
32.54 |
32.04 - 32.64 |
0.8742 times |
Fri 19 September 2025 |
32.69 (-0.37%) |
32.83 |
32.61 - 32.99 |
1.2072 times |
Fri 12 September 2025 |
32.81 (0.49%) |
32.65 |
32.34 - 32.92 |
1.039 times |
Fri 05 September 2025 |
32.65 (0.68%) |
32.31 |
32.11 - 32.77 |
1.0308 times |
Fri 29 August 2025 |
32.43 (0%) |
32.35 |
32.34 - 32.43 |
0.2524 times |
Fri 29 August 2025 |
32.43 (-0.58%) |
32.43 |
32.21 - 32.49 |
1.2844 times |
Fri 22 August 2025 |
32.62 (1.34%) |
32.25 |
32.00 - 32.68 |
1.1734 times |
Monthly price and charts BarclaysEtn Strong monthly Stock price targets for BarclaysEtn CAPE are 31.97 and 32.96 | Monthly Target 1 | 31.15 | | Monthly Target 2 | 31.79 | | Monthly Target 3 | 32.143333333333 | | Monthly Target 4 | 32.78 | | Monthly Target 5 | 33.13 |
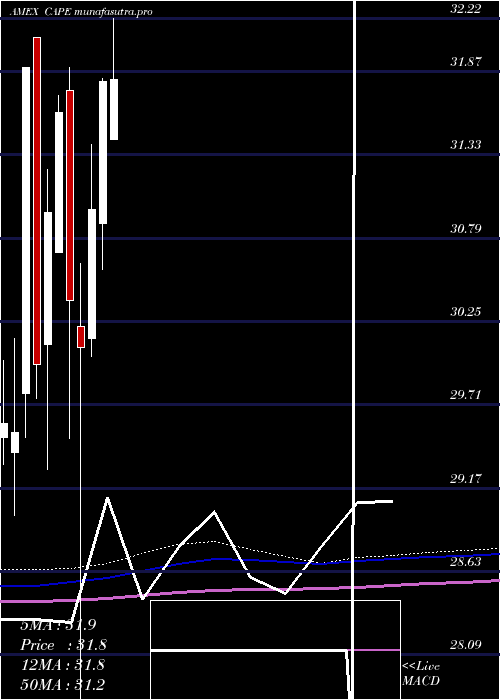
Monthly price and volumes Barclays Etn
| Date |
Closing |
Open |
Range |
Volume |
Thu 23 October 2025 |
32.42 (-0.49%) |
32.39 |
31.51 - 32.50 |
0.3886 times |
Tue 30 September 2025 |
32.58 (0.46%) |
32.31 |
32.04 - 32.99 |
0.4811 times |
Fri 29 August 2025 |
32.43 (3.05%) |
31.29 |
31.20 - 32.68 |
0.6144 times |
Thu 31 July 2025 |
31.47 (-1.07%) |
31.43 |
31.38 - 32.46 |
0.8855 times |
Mon 30 June 2025 |
31.81 (2.68%) |
30.89 |
30.59 - 31.83 |
0.3637 times |
Fri 30 May 2025 |
30.98 (2.99%) |
30.14 |
30.02 - 31.40 |
0.5719 times |
Wed 30 April 2025 |
30.08 (-1.02%) |
30.22 |
27.01 - 30.63 |
0.7178 times |
Mon 31 March 2025 |
30.39 (-3.86%) |
31.75 |
29.49 - 31.90 |
0.5989 times |
Fri 28 February 2025 |
31.61 (2.1%) |
30.70 |
30.70 - 31.72 |
0.9992 times |
Fri 31 January 2025 |
30.96 (3.3%) |
30.10 |
29.29 - 31.24 |
4.3789 times |
Tue 31 December 2024 |
29.97 (-6.05%) |
32.09 |
29.75 - 32.09 |
2.0881 times |
DMA SMA EMA moving averages of Barclays Etn CAPE
DMA (daily moving average) of Barclays Etn CAPE
| DMA period | DMA value | | 5 day DMA | 32.36 | | 12 day DMA | 32.1 | | 20 day DMA | 32.19 | | 35 day DMA | 32.37 | | 50 day DMA | 32.35 | | 100 day DMA | 32 | | 150 day DMA | 31.3 | | 200 day DMA | 31.16 | EMA (exponential moving average) of Barclays Etn CAPE
| EMA period | EMA current | EMA prev | EMA prev2 | | 5 day EMA | 32.33 | 32.29 | 32.25 | | 12 day EMA | 32.24 | 32.21 | 32.18 | | 20 day EMA | 32.24 | 32.22 | 32.2 | | 35 day EMA | 32.25 | 32.24 | 32.23 | | 50 day EMA | 32.32 | 32.32 | 32.32 |
SMA (simple moving average) of Barclays Etn CAPE
| SMA period | SMA current | SMA prev | SMA prev2 | | 5 day SMA | 32.36 | 32.27 | 32.23 | | 12 day SMA | 32.1 | 32.08 | 32.06 | | 20 day SMA | 32.19 | 32.18 | 32.18 | | 35 day SMA | 32.37 | 32.37 | 32.37 | | 50 day SMA | 32.35 | 32.35 | 32.35 | | 100 day SMA | 32 | 31.99 | 31.97 | | 150 day SMA | 31.3 | 31.29 | 31.27 | | 200 day SMA | 31.16 | 31.14 | 31.13 |
|
|
