PacerUs CALF full analysis,charts,indicators,moving averages,SMA,DMA,EMA,ADX,MACD,RSIPacer Us CALF WideScreen charts, DMA,SMA,EMA technical analysis, forecast prediction, by indicators ADX,MACD,RSI,CCI AMEX stock exchange
Daily price and charts and targets PacerUs Strong Daily Stock price targets for PacerUs CALF are 43.72 and 44.27 | Daily Target 1 | 43.27 | | Daily Target 2 | 43.62 | | Daily Target 3 | 43.823333333333 | | Daily Target 4 | 44.17 | | Daily Target 5 | 44.37 |
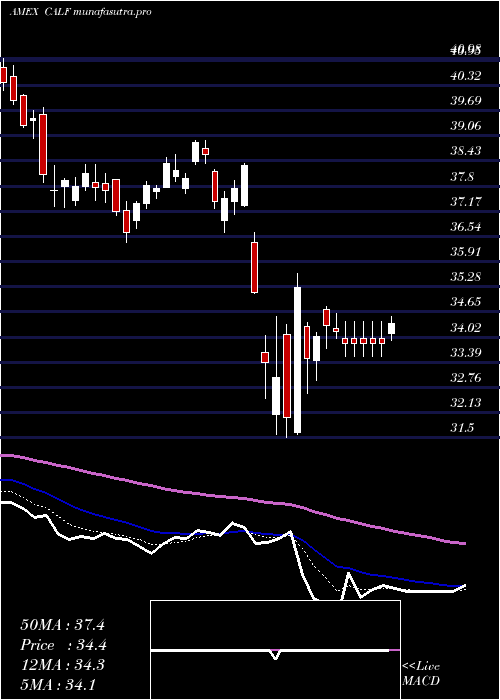
Daily price and volume Pacer Us
| Date |
Closing |
Open |
Range |
Volume |
Thu 23 October 2025 |
43.96 (1.27%) |
43.59 |
43.48 - 44.03 |
0.839 times |
Wed 22 October 2025 |
43.41 (0%) |
43.38 |
43.12 - 43.69 |
0.8852 times |
Tue 21 October 2025 |
43.41 (1.19%) |
43.00 |
42.96 - 43.56 |
0.9277 times |
Mon 20 October 2025 |
42.90 (0.87%) |
42.81 |
42.68 - 43.00 |
0.5644 times |
Fri 17 October 2025 |
42.53 (0.16%) |
42.32 |
42.31 - 42.63 |
0.9027 times |
Thu 16 October 2025 |
42.46 (-0.93%) |
42.85 |
42.17 - 43.06 |
1.1666 times |
Wed 15 October 2025 |
42.86 (0.09%) |
43.11 |
42.55 - 43.35 |
0.9832 times |
Tue 14 October 2025 |
42.82 (1.01%) |
41.89 |
41.85 - 43.03 |
1.2119 times |
Mon 13 October 2025 |
42.39 (1.87%) |
42.20 |
41.99 - 42.48 |
1.0179 times |
Fri 10 October 2025 |
41.61 (-3.52%) |
43.10 |
41.60 - 43.16 |
1.5013 times |
Thu 09 October 2025 |
43.13 (-1.26%) |
43.73 |
43.08 - 43.81 |
1.1472 times |
Weekly price and charts PacerUs Strong weekly Stock price targets for PacerUs CALF are 43.32 and 44.67 | Weekly Target 1 | 42.21 | | Weekly Target 2 | 43.08 | | Weekly Target 3 | 43.556666666667 | | Weekly Target 4 | 44.43 | | Weekly Target 5 | 44.91 |
Weekly price and volumes for Pacer Us
| Date |
Closing |
Open |
Range |
Volume |
Thu 23 October 2025 |
43.96 (3.36%) |
42.81 |
42.68 - 44.03 |
0.6294 times |
Fri 17 October 2025 |
42.53 (2.21%) |
42.20 |
41.85 - 43.35 |
1.0336 times |
Fri 10 October 2025 |
41.61 (-5.9%) |
44.40 |
41.60 - 44.40 |
1.0611 times |
Fri 03 October 2025 |
44.22 (0.2%) |
44.27 |
43.42 - 44.58 |
1.0263 times |
Fri 26 September 2025 |
44.13 (0.55%) |
43.74 |
43.43 - 44.58 |
1.0942 times |
Fri 19 September 2025 |
43.89 (0.78%) |
43.75 |
43.37 - 44.65 |
1.0974 times |
Fri 12 September 2025 |
43.55 (-0.5%) |
43.84 |
43.12 - 44.14 |
1.4519 times |
Fri 05 September 2025 |
43.77 (1.06%) |
43.00 |
42.99 - 44.12 |
1.1209 times |
Fri 29 August 2025 |
43.31 (0%) |
43.31 |
43.16 - 43.55 |
0.2025 times |
Fri 29 August 2025 |
43.31 (-0.18%) |
43.27 |
42.91 - 43.55 |
1.2827 times |
Fri 22 August 2025 |
43.39 (3.41%) |
41.97 |
41.63 - 43.52 |
1.7706 times |

Monthly price and charts PacerUs Strong monthly Stock price targets for PacerUs CALF are 42.78 and 45.76 | Monthly Target 1 | 40.4 | | Monthly Target 2 | 42.18 | | Monthly Target 3 | 43.38 | | Monthly Target 4 | 45.16 | | Monthly Target 5 | 46.36 |
Monthly price and volumes Pacer Us
| Date |
Closing |
Open |
Range |
Volume |
Thu 23 October 2025 |
43.96 (0.41%) |
43.68 |
41.60 - 44.58 |
0.333 times |
Tue 30 September 2025 |
43.78 (1.09%) |
43.00 |
42.99 - 44.65 |
0.5402 times |
Fri 29 August 2025 |
43.31 (7.74%) |
39.75 |
38.95 - 43.55 |
0.7092 times |
Thu 31 July 2025 |
40.20 (0.95%) |
39.71 |
39.60 - 42.00 |
0.8649 times |
Mon 30 June 2025 |
39.82 (3.56%) |
38.49 |
37.98 - 40.12 |
0.8016 times |
Fri 30 May 2025 |
38.45 (7.85%) |
35.79 |
35.61 - 39.72 |
0.8403 times |
Wed 30 April 2025 |
35.65 (-4.93%) |
37.41 |
31.50 - 38.36 |
1.5972 times |
Mon 31 March 2025 |
37.50 (-5.02%) |
39.58 |
36.38 - 39.77 |
1.9098 times |
Fri 28 February 2025 |
39.48 (-10.5%) |
43.19 |
38.99 - 44.00 |
1.255 times |
Fri 31 January 2025 |
44.11 (0.23%) |
44.44 |
43.31 - 45.81 |
1.1488 times |
Tue 31 December 2024 |
44.01 (-8.16%) |
48.30 |
43.28 - 48.43 |
0.821 times |

DMA SMA EMA moving averages of Pacer Us CALF
DMA (daily moving average) of Pacer Us CALF
| DMA period | DMA value | | 5 day DMA | 43.24 | | 12 day DMA | 42.93 | | 20 day DMA | 43.35 | | 35 day DMA | 43.54 | | 50 day DMA | 43.35 | | 100 day DMA | 41.86 | | 150 day DMA | 40.07 | | 200 day DMA | 40.5 | EMA (exponential moving average) of Pacer Us CALF
| EMA period | EMA current | EMA prev | EMA prev2 | | 5 day EMA | 43.39 | 43.11 | 42.96 | | 12 day EMA | 43.22 | 43.08 | 43.02 | | 20 day EMA | 43.25 | 43.18 | 43.16 | | 35 day EMA | 43.2 | 43.15 | 43.13 | | 50 day EMA | 43.17 | 43.14 | 43.13 |
SMA (simple moving average) of Pacer Us CALF
| SMA period | SMA current | SMA prev | SMA prev2 | | 5 day SMA | 43.24 | 42.94 | 42.83 | | 12 day SMA | 42.93 | 42.9 | 42.95 | | 20 day SMA | 43.35 | 43.33 | 43.36 | | 35 day SMA | 43.54 | 43.53 | 43.53 | | 50 day SMA | 43.35 | 43.31 | 43.29 | | 100 day SMA | 41.86 | 41.81 | 41.76 | | 150 day SMA | 40.07 | 40.03 | 40 | | 200 day SMA | 40.5 | 40.5 | 40.5 |
|
|
