B2goldCorp BTG full analysis,charts,indicators,moving averages,SMA,DMA,EMA,ADX,MACD,RSIB2gold Corp BTG WideScreen charts, DMA,SMA,EMA technical analysis, forecast prediction, by indicators ADX,MACD,RSI,CCI AMEX stock exchange
Daily price and charts and targets B2goldCorp Strong Daily Stock price targets for B2goldCorp BTG are 5.12 and 5.36 | Daily Target 1 | 4.92 | | Daily Target 2 | 5.07 | | Daily Target 3 | 5.1633333333333 | | Daily Target 4 | 5.31 | | Daily Target 5 | 5.4 |
Daily price and volume B2gold Corp
| Date |
Closing |
Open |
Range |
Volume |
Fri 24 October 2025 |
5.21 (-0.19%) |
5.16 |
5.02 - 5.26 |
0.6528 times |
Thu 23 October 2025 |
5.22 (0.77%) |
5.28 |
5.19 - 5.33 |
0.7181 times |
Wed 22 October 2025 |
5.18 (0%) |
5.26 |
4.77 - 5.26 |
0.708 times |
Tue 21 October 2025 |
5.18 (-8.8%) |
5.25 |
5.02 - 5.36 |
1.5071 times |
Mon 20 October 2025 |
5.68 (2.34%) |
5.65 |
5.54 - 5.74 |
1.0469 times |
Fri 17 October 2025 |
5.55 (-6.57%) |
5.85 |
5.46 - 6.09 |
1.3107 times |
Thu 16 October 2025 |
5.94 (4.76%) |
5.70 |
5.61 - 6.03 |
1.2197 times |
Wed 15 October 2025 |
5.67 (6.18%) |
5.43 |
5.41 - 5.69 |
1.1251 times |
Tue 14 October 2025 |
5.34 (0.56%) |
5.20 |
5.15 - 5.38 |
1.0087 times |
Mon 13 October 2025 |
5.31 (4.53%) |
5.24 |
5.20 - 5.34 |
0.7028 times |
Fri 10 October 2025 |
5.08 (0.2%) |
5.11 |
5.01 - 5.14 |
0.9553 times |
Weekly price and charts B2goldCorp Strong weekly Stock price targets for B2goldCorp BTG are 4.51 and 5.48 | Weekly Target 1 | 4.27 | | Weekly Target 2 | 4.74 | | Weekly Target 3 | 5.24 | | Weekly Target 4 | 5.71 | | Weekly Target 5 | 6.21 |
Weekly price and volumes for B2gold Corp
| Date |
Closing |
Open |
Range |
Volume |
Fri 24 October 2025 |
5.21 (-6.13%) |
5.65 |
4.77 - 5.74 |
1.0257 times |
Fri 17 October 2025 |
5.55 (9.25%) |
5.24 |
5.15 - 6.09 |
1.1882 times |
Fri 10 October 2025 |
5.08 (0%) |
5.12 |
5.00 - 5.40 |
1.2853 times |
Fri 03 October 2025 |
5.08 (3.25%) |
5.02 |
4.83 - 5.09 |
1.2584 times |
Fri 26 September 2025 |
4.92 (9.58%) |
4.61 |
4.58 - 4.99 |
1.2714 times |
Fri 19 September 2025 |
4.49 (0%) |
4.59 |
4.19 - 4.60 |
1.5016 times |
Fri 12 September 2025 |
4.49 (7.67%) |
4.24 |
4.20 - 4.55 |
0.9175 times |
Fri 05 September 2025 |
4.17 (0.97%) |
4.20 |
4.01 - 4.34 |
0.8822 times |
Fri 29 August 2025 |
4.13 (0%) |
4.03 |
4.02 - 4.14 |
0.1251 times |
Fri 29 August 2025 |
4.13 (3.77%) |
4.01 |
3.93 - 4.14 |
0.5446 times |
Fri 22 August 2025 |
3.98 (2.05%) |
3.90 |
3.72 - 4.01 |
0.5948 times |
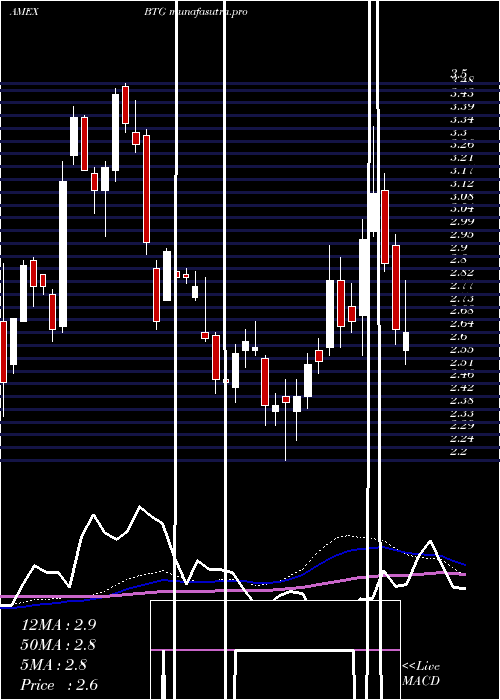
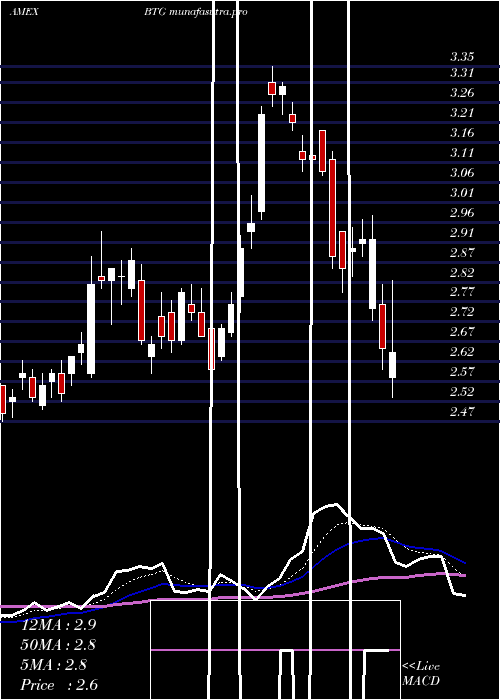
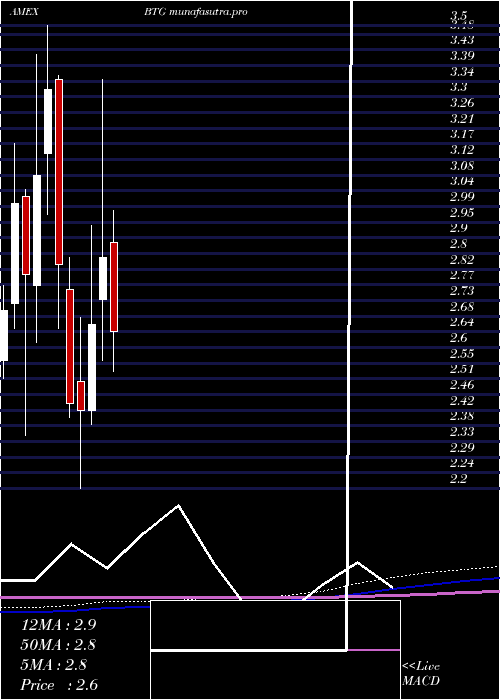
Monthly price and charts B2goldCorp Strong monthly Stock price targets for B2goldCorp BTG are 4.99 and 6.31 | Monthly Target 1 | 4.04 | | Monthly Target 2 | 4.62 | | Monthly Target 3 | 5.3566666666667 | | Monthly Target 4 | 5.94 | | Monthly Target 5 | 6.68 |
Monthly price and volumes B2gold Corp
| Date |
Closing |
Open |
Range |
Volume |
Fri 24 October 2025 |
5.21 (5.25%) |
5.00 |
4.77 - 6.09 |
1.093 times |
Tue 30 September 2025 |
4.95 (19.85%) |
4.20 |
4.01 - 5.07 |
1.3155 times |
Fri 29 August 2025 |
4.13 (22.55%) |
3.45 |
3.38 - 4.14 |
0.7366 times |
Thu 31 July 2025 |
3.37 (-6.65%) |
3.65 |
3.31 - 3.76 |
0.8451 times |
Mon 30 June 2025 |
3.61 (7.12%) |
3.44 |
3.43 - 3.83 |
1.2225 times |
Fri 30 May 2025 |
3.37 (8.36%) |
3.04 |
2.86 - 3.48 |
1.163 times |
Wed 30 April 2025 |
3.11 (9.12%) |
2.89 |
2.53 - 3.51 |
1.2125 times |
Mon 31 March 2025 |
2.85 (7.14%) |
2.73 |
2.56 - 3.35 |
0.9791 times |
Fri 28 February 2025 |
2.66 (9.92%) |
2.42 |
2.38 - 2.94 |
0.8194 times |
Fri 31 January 2025 |
2.42 (-0.82%) |
2.50 |
2.20 - 2.68 |
0.6133 times |
Tue 31 December 2024 |
2.44 (-13.78%) |
2.76 |
2.40 - 2.85 |
0.2763 times |
DMA SMA EMA moving averages of B2gold Corp BTG
DMA (daily moving average) of B2gold Corp BTG
| DMA period | DMA value | | 5 day DMA | 5.29 | | 12 day DMA | 5.37 | | 20 day DMA | 5.27 | | 35 day DMA | 4.95 | | 50 day DMA | 4.67 | | 100 day DMA | 4.13 | | 150 day DMA | 3.8 | | 200 day DMA | 3.51 | EMA (exponential moving average) of B2gold Corp BTG
| EMA period | EMA current | EMA prev | EMA prev2 | | 5 day EMA | 5.28 | 5.32 | 5.37 | | 12 day EMA | 5.3 | 5.32 | 5.34 | | 20 day EMA | 5.22 | 5.22 | 5.22 | | 35 day EMA | 4.96 | 4.95 | 4.93 | | 50 day EMA | 4.65 | 4.63 | 4.61 |
SMA (simple moving average) of B2gold Corp BTG
| SMA period | SMA current | SMA prev | SMA prev2 | | 5 day SMA | 5.29 | 5.36 | 5.51 | | 12 day SMA | 5.37 | 5.38 | 5.38 | | 20 day SMA | 5.27 | 5.26 | 5.24 | | 35 day SMA | 4.95 | 4.92 | 4.89 | | 50 day SMA | 4.67 | 4.65 | 4.62 | | 100 day SMA | 4.13 | 4.12 | 4.1 | | 150 day SMA | 3.8 | 3.78 | 3.77 | | 200 day SMA | 3.51 | 3.49 | 3.48 |
|
|
