BlueRidge BRBS full analysis,charts,indicators,moving averages,SMA,DMA,EMA,ADX,MACD,RSIBlue Ridge BRBS WideScreen charts, DMA,SMA,EMA technical analysis, forecast prediction, by indicators ADX,MACD,RSI,CCI AMEX stock exchange
Daily price and charts and targets BlueRidge Strong Daily Stock price targets for BlueRidge BRBS are 4.27 and 4.34 | Daily Target 1 | 4.26 | | Daily Target 2 | 4.28 | | Daily Target 3 | 4.3266666666667 | | Daily Target 4 | 4.35 | | Daily Target 5 | 4.4 |
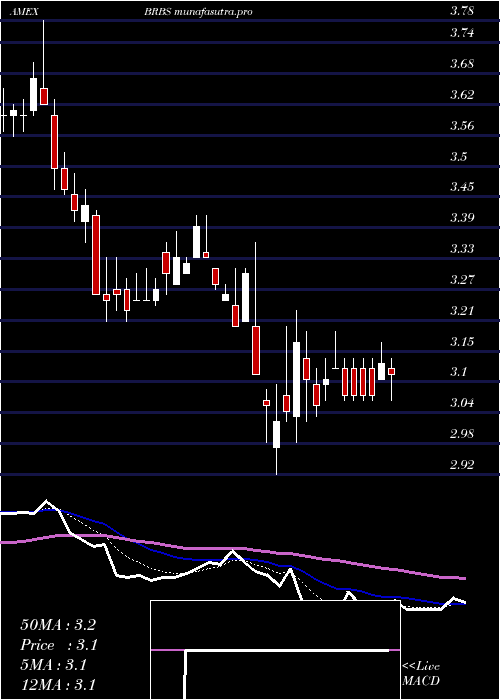
Daily price and volume Blue Ridge
| Date |
Closing |
Open |
Range |
Volume |
Thu 23 October 2025 |
4.31 (-0.46%) |
4.37 |
4.30 - 4.37 |
0.2902 times |
Wed 22 October 2025 |
4.33 (0.7%) |
4.30 |
4.30 - 4.36 |
0.5769 times |
Tue 21 October 2025 |
4.30 (-0.46%) |
4.33 |
4.29 - 4.34 |
0.3347 times |
Mon 20 October 2025 |
4.32 (0.47%) |
4.33 |
4.32 - 4.36 |
0.4741 times |
Fri 17 October 2025 |
4.30 (1.18%) |
4.28 |
4.23 - 4.33 |
1.4275 times |
Thu 16 October 2025 |
4.25 (-2.3%) |
4.29 |
4.21 - 4.39 |
2.6883 times |
Wed 15 October 2025 |
4.35 (4.07%) |
4.22 |
4.19 - 4.35 |
2.0562 times |
Tue 14 October 2025 |
4.18 (1.95%) |
4.05 |
4.03 - 4.19 |
0.7032 times |
Mon 13 October 2025 |
4.10 (-0.49%) |
4.18 |
4.07 - 4.18 |
0.5896 times |
Fri 10 October 2025 |
4.12 (-1.67%) |
4.19 |
4.12 - 4.24 |
0.8592 times |
Thu 09 October 2025 |
4.19 (-0.71%) |
4.21 |
4.14 - 4.21 |
0.3521 times |
Weekly price and charts BlueRidge Strong weekly Stock price targets for BlueRidge BRBS are 4.26 and 4.34 | Weekly Target 1 | 4.24 | | Weekly Target 2 | 4.28 | | Weekly Target 3 | 4.3233333333333 | | Weekly Target 4 | 4.36 | | Weekly Target 5 | 4.4 |
Weekly price and volumes for Blue Ridge
| Date |
Closing |
Open |
Range |
Volume |
Thu 23 October 2025 |
4.31 (0.23%) |
4.33 |
4.29 - 4.37 |
0.3179 times |
Fri 17 October 2025 |
4.30 (4.37%) |
4.18 |
4.03 - 4.39 |
1.4159 times |
Fri 10 October 2025 |
4.12 (-2.6%) |
4.28 |
4.12 - 4.28 |
0.4628 times |
Fri 03 October 2025 |
4.23 (-2.08%) |
4.31 |
4.16 - 4.31 |
0.6396 times |
Fri 26 September 2025 |
4.32 (0.47%) |
4.27 |
4.24 - 4.41 |
0.6939 times |
Fri 19 September 2025 |
4.30 (4.37%) |
4.13 |
4.12 - 4.36 |
1.7281 times |
Fri 12 September 2025 |
4.12 (1.48%) |
4.08 |
4.03 - 4.22 |
1.0274 times |
Fri 05 September 2025 |
4.06 (1.25%) |
4.00 |
3.95 - 4.17 |
0.7835 times |
Fri 29 August 2025 |
4.01 (0%) |
3.99 |
3.95 - 4.05 |
0.1494 times |
Fri 29 August 2025 |
4.01 (4.43%) |
3.96 |
3.86 - 4.14 |
2.7815 times |
Fri 22 August 2025 |
3.84 (3.78%) |
3.71 |
3.63 - 3.91 |
1.4802 times |

Monthly price and charts BlueRidge Strong monthly Stock price targets for BlueRidge BRBS are 4.17 and 4.53 | Monthly Target 1 | 3.88 | | Monthly Target 2 | 4.1 | | Monthly Target 3 | 4.2433333333333 | | Monthly Target 4 | 4.46 | | Monthly Target 5 | 4.6 |
Monthly price and volumes Blue Ridge
| Date |
Closing |
Open |
Range |
Volume |
Thu 23 October 2025 |
4.31 (1.89%) |
4.20 |
4.03 - 4.39 |
0.5176 times |
Tue 30 September 2025 |
4.23 (5.49%) |
4.00 |
3.95 - 4.41 |
0.9184 times |
Fri 29 August 2025 |
4.01 (9.26%) |
3.61 |
3.40 - 4.14 |
1.277 times |
Thu 31 July 2025 |
3.67 (2.23%) |
3.59 |
3.49 - 4.05 |
1.6623 times |
Mon 30 June 2025 |
3.59 (3.46%) |
3.45 |
3.25 - 3.70 |
2.9133 times |
Fri 30 May 2025 |
3.47 (1.17%) |
3.53 |
3.41 - 3.66 |
0.5061 times |
Wed 30 April 2025 |
3.43 (5.21%) |
3.24 |
2.92 - 3.58 |
0.4867 times |
Mon 31 March 2025 |
3.26 (-11.17%) |
3.65 |
3.21 - 3.78 |
0.6227 times |
Fri 28 February 2025 |
3.67 (8.9%) |
3.32 |
3.26 - 3.83 |
0.4847 times |
Fri 31 January 2025 |
3.37 (4.66%) |
3.24 |
3.15 - 3.48 |
0.6112 times |
Tue 31 December 2024 |
3.22 (-8%) |
3.52 |
3.09 - 3.58 |
0.4476 times |

DMA SMA EMA moving averages of Blue Ridge BRBS
DMA (daily moving average) of Blue Ridge BRBS
| DMA period | DMA value | | 5 day DMA | 4.31 | | 12 day DMA | 4.25 | | 20 day DMA | 4.25 | | 35 day DMA | 4.23 | | 50 day DMA | 4.13 | | 100 day DMA | 3.85 | | 150 day DMA | 3.68 | | 200 day DMA | 3.62 | EMA (exponential moving average) of Blue Ridge BRBS
| EMA period | EMA current | EMA prev | EMA prev2 | | 5 day EMA | 4.3 | 4.3 | 4.29 | | 12 day EMA | 4.27 | 4.26 | 4.25 | | 20 day EMA | 4.25 | 4.24 | 4.23 | | 35 day EMA | 4.18 | 4.17 | 4.16 | | 50 day EMA | 4.12 | 4.11 | 4.1 |
SMA (simple moving average) of Blue Ridge BRBS
| SMA period | SMA current | SMA prev | SMA prev2 | | 5 day SMA | 4.31 | 4.3 | 4.3 | | 12 day SMA | 4.25 | 4.24 | 4.23 | | 20 day SMA | 4.25 | 4.25 | 4.25 | | 35 day SMA | 4.23 | 4.22 | 4.21 | | 50 day SMA | 4.13 | 4.11 | 4.1 | | 100 day SMA | 3.85 | 3.84 | 3.83 | | 150 day SMA | 3.68 | 3.67 | 3.67 | | 200 day SMA | 3.62 | 3.61 | 3.61 |
|
|
