GX BRAZ full analysis,charts,indicators,moving averages,SMA,DMA,EMA,ADX,MACD,RSIG X BRAZ WideScreen charts, DMA,SMA,EMA technical analysis, forecast prediction, by indicators ADX,MACD,RSI,CCI AMEX stock exchange
Daily price and charts and targets GX Strong Daily Stock price targets for GX BRAZ are 25.73 and 25.73 | Daily Target 1 | 25.73 | | Daily Target 2 | 25.73 | | Daily Target 3 | 25.73 | | Daily Target 4 | 25.73 | | Daily Target 5 | 25.73 |
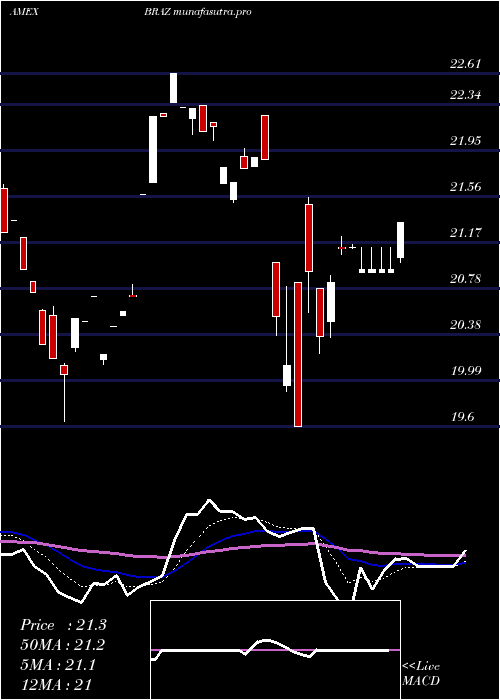
Daily price and volume G X
| Date |
Closing |
Open |
Range |
Volume |
Thu 23 October 2025 |
25.73 (1.18%) |
25.73 |
25.73 - 25.73 |
0.1266 times |
Wed 22 October 2025 |
25.43 (0.12%) |
25.32 |
25.32 - 25.43 |
1.742 times |
Tue 21 October 2025 |
25.40 (-0.35%) |
25.49 |
25.40 - 25.49 |
0.1155 times |
Mon 20 October 2025 |
25.49 (0.99%) |
25.49 |
25.49 - 25.49 |
0.0462 times |
Fri 17 October 2025 |
25.24 (1.28%) |
25.27 |
25.21 - 25.27 |
1.8942 times |
Thu 16 October 2025 |
24.92 (-0.28%) |
24.92 |
24.92 - 24.92 |
0 times |
Wed 15 October 2025 |
24.99 (1.5%) |
25.10 |
24.99 - 25.10 |
1.4784 times |
Tue 14 October 2025 |
24.62 (-1.08%) |
24.85 |
24.60 - 24.94 |
4.4815 times |
Mon 13 October 2025 |
24.89 (1.59%) |
24.89 |
24.89 - 24.89 |
0.0231 times |
Fri 10 October 2025 |
24.50 (-3.01%) |
25.00 |
24.50 - 25.00 |
0.0924 times |
Thu 09 October 2025 |
25.26 (-0.55%) |
25.26 |
25.26 - 25.26 |
0.0231 times |
Weekly price and charts GX Strong weekly Stock price targets for GX BRAZ are 25.53 and 25.94 | Weekly Target 1 | 25.18 | | Weekly Target 2 | 25.46 | | Weekly Target 3 | 25.593333333333 | | Weekly Target 4 | 25.87 | | Weekly Target 5 | 26 |
Weekly price and volumes for G X
| Date |
Closing |
Open |
Range |
Volume |
Thu 23 October 2025 |
25.73 (1.94%) |
25.49 |
25.32 - 25.73 |
1.4224 times |
Fri 17 October 2025 |
25.24 (3.02%) |
24.89 |
24.60 - 25.27 |
5.5188 times |
Fri 10 October 2025 |
24.50 (-4.85%) |
25.75 |
24.50 - 25.75 |
0.1457 times |
Fri 03 October 2025 |
25.75 (-0.96%) |
26.31 |
25.49 - 26.45 |
0.1295 times |
Fri 26 September 2025 |
26.00 (-0.34%) |
25.87 |
25.65 - 26.45 |
0.5017 times |
Fri 19 September 2025 |
26.09 (2.92%) |
25.68 |
25.68 - 26.13 |
0.4693 times |
Fri 12 September 2025 |
25.35 (1.36%) |
24.85 |
24.85 - 25.51 |
1.1005 times |
Fri 05 September 2025 |
25.01 (0.16%) |
24.60 |
24.54 - 25.02 |
0.2266 times |
Fri 29 August 2025 |
24.97 (0%) |
25.04 |
24.97 - 25.08 |
0.1295 times |
Fri 29 August 2025 |
24.97 (2.71%) |
24.61 |
24.26 - 25.08 |
0.3561 times |
Fri 22 August 2025 |
24.31 (1.63%) |
24.00 |
23.24 - 24.32 |
0.4855 times |
Monthly price and charts GX Strong monthly Stock price targets for GX BRAZ are 24.43 and 25.81 | Monthly Target 1 | 23.99 | | Monthly Target 2 | 24.86 | | Monthly Target 3 | 25.37 | | Monthly Target 4 | 26.24 | | Monthly Target 5 | 26.75 |
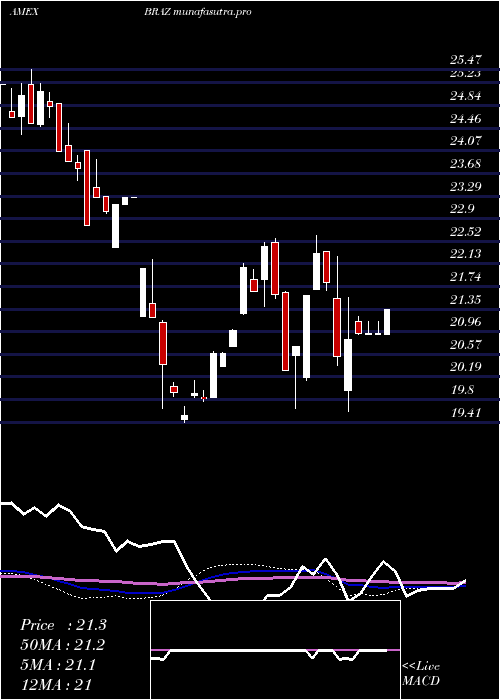
Monthly price and volumes G X
| Date |
Closing |
Open |
Range |
Volume |
Thu 23 October 2025 |
25.73 (-1.98%) |
25.88 |
24.50 - 25.88 |
1.5482 times |
Tue 30 September 2025 |
26.25 (5.13%) |
24.60 |
24.54 - 26.45 |
0.5162 times |
Fri 29 August 2025 |
24.97 (11.03%) |
22.72 |
22.62 - 25.08 |
0.3441 times |
Thu 31 July 2025 |
22.49 (-7.79%) |
24.30 |
20.50 - 24.64 |
1.2148 times |
Mon 30 June 2025 |
24.39 (5.91%) |
23.03 |
23.03 - 24.44 |
0.5829 times |
Fri 30 May 2025 |
23.03 (0.88%) |
22.65 |
20.38 - 23.78 |
0.7409 times |
Wed 30 April 2025 |
22.83 (5.3%) |
21.90 |
19.60 - 23.15 |
3.1242 times |
Mon 31 March 2025 |
21.68 (6.8%) |
20.55 |
19.64 - 22.61 |
0.6164 times |
Fri 28 February 2025 |
20.30 (-7.98%) |
21.85 |
20.30 - 22.56 |
0.6145 times |
Fri 31 January 2025 |
22.06 (13.24%) |
19.58 |
19.52 - 22.14 |
0.6979 times |
Tue 31 December 2024 |
19.48 (-16.29%) |
21.23 |
19.41 - 22.20 |
0.8394 times |

DMA SMA EMA moving averages of G X BRAZ
DMA (daily moving average) of G X BRAZ
| DMA period | DMA value | | 5 day DMA | 25.46 | | 12 day DMA | 25.16 | | 20 day DMA | 25.43 | | 35 day DMA | 25.53 | | 50 day DMA | 25.17 | | 100 day DMA | 24.35 | | 150 day DMA | 23.64 | | 200 day DMA | 23.02 | EMA (exponential moving average) of G X BRAZ
| EMA period | EMA current | EMA prev | EMA prev2 | | 5 day EMA | 25.45 | 25.31 | 25.25 | | 12 day EMA | 25.36 | 25.29 | 25.26 | | 20 day EMA | 25.36 | 25.32 | 25.31 | | 35 day EMA | 25.19 | 25.16 | 25.14 | | 50 day EMA | 25.09 | 25.06 | 25.04 |
SMA (simple moving average) of G X BRAZ
| SMA period | SMA current | SMA prev | SMA prev2 | | 5 day SMA | 25.46 | 25.3 | 25.21 | | 12 day SMA | 25.16 | 25.11 | 25.14 | | 20 day SMA | 25.43 | 25.44 | 25.48 | | 35 day SMA | 25.53 | 25.5 | 25.48 | | 50 day SMA | 25.17 | 25.13 | 25.1 | | 100 day SMA | 24.35 | 24.32 | 24.3 | | 150 day SMA | 23.64 | 23.62 | 23.6 | | 200 day SMA | 23.02 | 22.99 | 22.96 |
|
|
