UsBrent BNO full analysis,charts,indicators,moving averages,SMA,DMA,EMA,ADX,MACD,RSIUs Brent BNO WideScreen charts, DMA,SMA,EMA technical analysis, forecast prediction, by indicators ADX,MACD,RSI,CCI AMEX stock exchange
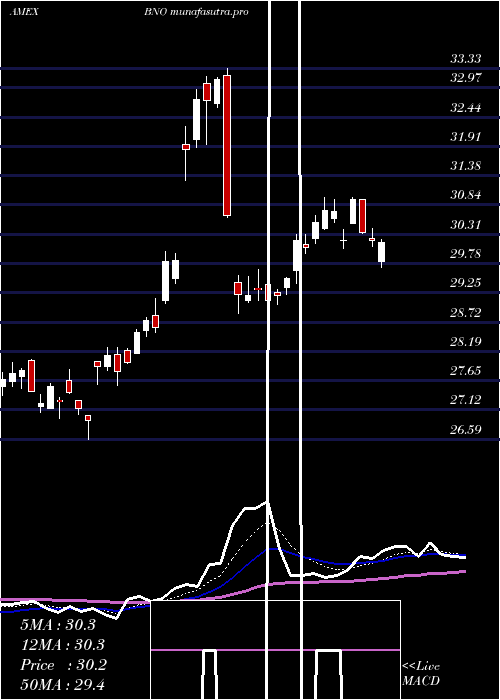
Daily price and charts and targets UsBrent Strong Daily Stock price targets for UsBrent BNO are 29.6 and 29.95 | Daily Target 1 | 29.53 | | Daily Target 2 | 29.66 | | Daily Target 3 | 29.883333333333 | | Daily Target 4 | 30.01 | | Daily Target 5 | 30.23 |
Daily price and volume Us Brent
| Date |
Closing |
Open |
Range |
Volume |
Fri 24 October 2025 |
29.78 (0.17%) |
29.80 |
29.76 - 30.11 |
0.6254 times |
Thu 23 October 2025 |
29.73 (3.16%) |
29.53 |
29.52 - 29.99 |
1.229 times |
Wed 22 October 2025 |
28.82 (3.19%) |
28.25 |
28.25 - 28.99 |
1.364 times |
Tue 21 October 2025 |
27.93 (0.61%) |
27.84 |
27.47 - 28.24 |
0.9618 times |
Mon 20 October 2025 |
27.76 (-0.39%) |
27.83 |
27.43 - 27.83 |
0.7687 times |
Fri 17 October 2025 |
27.87 (0.32%) |
27.50 |
27.30 - 27.99 |
0.979 times |
Thu 16 October 2025 |
27.78 (-1.66%) |
28.68 |
27.68 - 28.68 |
1.1569 times |
Wed 15 October 2025 |
28.25 (0%) |
28.54 |
28.11 - 28.59 |
0.8088 times |
Tue 14 October 2025 |
28.25 (-2.15%) |
28.38 |
28.07 - 28.48 |
1.4692 times |
Mon 13 October 2025 |
28.87 (1.33%) |
28.85 |
28.69 - 29.03 |
0.6372 times |
Fri 10 October 2025 |
28.49 (-3.78%) |
28.95 |
28.43 - 29.19 |
1.5091 times |
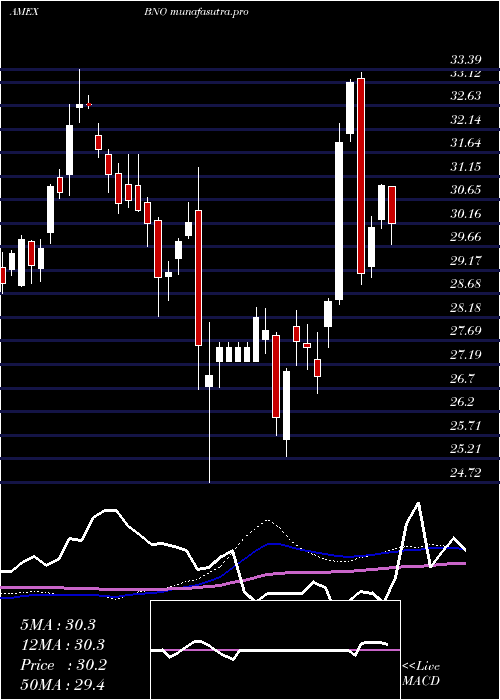
Weekly price and charts UsBrent Strong weekly Stock price targets for UsBrent BNO are 28.61 and 31.29 | Weekly Target 1 | 26.43 | | Weekly Target 2 | 28.1 | | Weekly Target 3 | 29.106666666667 | | Weekly Target 4 | 30.78 | | Weekly Target 5 | 31.79 |
Weekly price and volumes for Us Brent
| Date |
Closing |
Open |
Range |
Volume |
Fri 24 October 2025 |
29.78 (6.85%) |
27.83 |
27.43 - 30.11 |
1.0531 times |
Fri 17 October 2025 |
27.87 (-2.18%) |
28.85 |
27.30 - 29.03 |
1.0748 times |
Fri 10 October 2025 |
28.49 (-2.7%) |
29.65 |
28.43 - 30.25 |
1.0399 times |
Fri 03 October 2025 |
29.28 (-6.27%) |
30.69 |
29.08 - 30.72 |
1.4356 times |
Fri 26 September 2025 |
31.24 (4.27%) |
29.73 |
29.69 - 31.73 |
0.9622 times |
Fri 19 September 2025 |
29.96 (-0.37%) |
30.41 |
29.89 - 30.92 |
0.6807 times |
Fri 12 September 2025 |
30.07 (1.79%) |
29.94 |
29.58 - 30.50 |
1.1389 times |
Fri 05 September 2025 |
29.54 (-2.57%) |
30.81 |
29.28 - 31.16 |
1.2676 times |
Fri 29 August 2025 |
30.32 (0%) |
30.49 |
30.27 - 30.51 |
0.196 times |
Fri 29 August 2025 |
30.32 (0.2%) |
30.45 |
29.95 - 30.78 |
1.1513 times |
Fri 22 August 2025 |
30.26 (2.75%) |
29.27 |
29.11 - 30.33 |
1.3542 times |
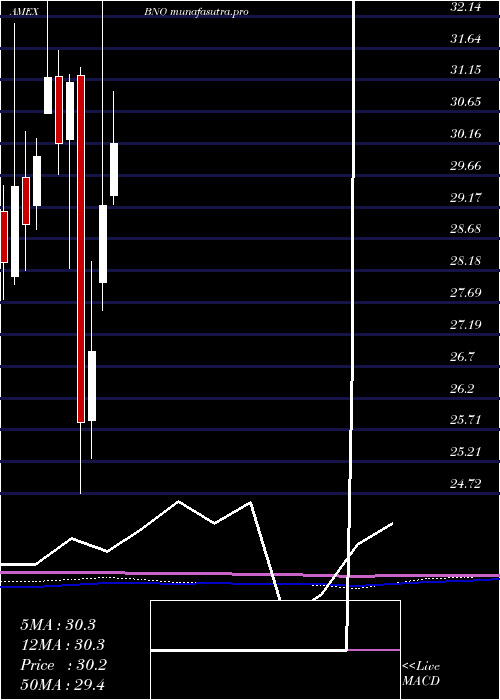
Monthly price and charts UsBrent Strong monthly Stock price targets for UsBrent BNO are 28.54 and 31.49 | Monthly Target 1 | 26.16 | | Monthly Target 2 | 27.97 | | Monthly Target 3 | 29.11 | | Monthly Target 4 | 30.92 | | Monthly Target 5 | 32.06 |
Monthly price and volumes Us Brent
| Date |
Closing |
Open |
Range |
Volume |
Fri 24 October 2025 |
29.78 (-0.9%) |
29.64 |
27.30 - 30.25 |
0.7549 times |
Tue 30 September 2025 |
30.05 (-0.89%) |
30.81 |
29.28 - 31.73 |
0.9213 times |
Fri 29 August 2025 |
30.32 (-4.77%) |
31.85 |
28.96 - 31.87 |
0.9913 times |
Thu 31 July 2025 |
31.84 (9.08%) |
29.35 |
29.21 - 32.40 |
0.9518 times |
Mon 30 June 2025 |
29.19 (8.39%) |
28.00 |
27.56 - 33.33 |
2.0057 times |
Fri 30 May 2025 |
26.93 (4.26%) |
25.86 |
25.26 - 28.32 |
0.9148 times |
Wed 30 April 2025 |
25.83 (-16.97%) |
31.21 |
24.72 - 31.34 |
1.4658 times |
Mon 31 March 2025 |
31.11 (3.15%) |
30.22 |
28.21 - 31.24 |
0.7916 times |
Fri 28 February 2025 |
30.16 (-3.27%) |
31.20 |
29.68 - 31.61 |
0.4675 times |
Fri 31 January 2025 |
31.18 (4.11%) |
30.63 |
30.63 - 33.39 |
0.7353 times |
Tue 31 December 2024 |
29.95 (3.63%) |
29.19 |
28.83 - 30.24 |
0.388 times |
DMA SMA EMA moving averages of Us Brent BNO
DMA (daily moving average) of Us Brent BNO
| DMA period | DMA value | | 5 day DMA | 28.8 | | 12 day DMA | 28.6 | | 20 day DMA | 29.08 | | 35 day DMA | 29.64 | | 50 day DMA | 29.8 | | 100 day DMA | 29.97 | | 150 day DMA | 29.2 | | 200 day DMA | 29.56 | EMA (exponential moving average) of Us Brent BNO
| EMA period | EMA current | EMA prev | EMA prev2 | | 5 day EMA | 29.1 | 28.76 | 28.28 | | 12 day EMA | 28.93 | 28.77 | 28.59 | | 20 day EMA | 29.09 | 29.02 | 28.94 | | 35 day EMA | 29.33 | 29.3 | 29.27 | | 50 day EMA | 29.68 | 29.68 | 29.68 |
SMA (simple moving average) of Us Brent BNO
| SMA period | SMA current | SMA prev | SMA prev2 | | 5 day SMA | 28.8 | 28.42 | 28.03 | | 12 day SMA | 28.6 | 28.62 | 28.63 | | 20 day SMA | 29.08 | 29.15 | 29.23 | | 35 day SMA | 29.64 | 29.64 | 29.65 | | 50 day SMA | 29.8 | 29.79 | 29.79 | | 100 day SMA | 29.97 | 29.95 | 29.92 | | 150 day SMA | 29.2 | 29.2 | 29.2 | | 200 day SMA | 29.56 | 29.57 | 29.57 |
|
|
